
Fig. 4
- ID
- ZDB-FIG-150506-54
- Publication
- Chou et al., 2014 - The Hemodynamically-Regulated Vascular Microenvironment Promotes Migration of the Steroidogenic Tissue during Its Interaction with Chromaffin Cells in the Zebrafish Embryo
- Other Figures
- All Figure Page
- Back to All Figure Page
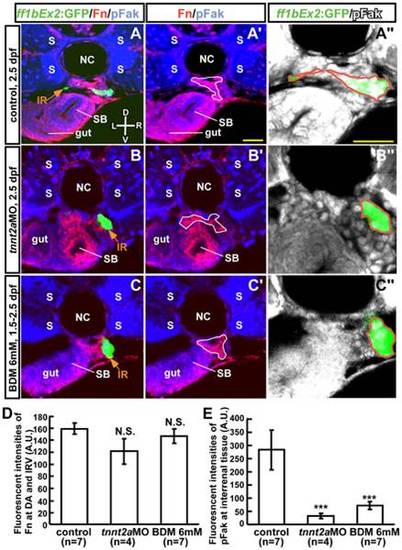
Effect of blood flow inhibition on the ECM microenvironment and pFak distribution in interrenal steroidogenic tissue. Transverse sections of Tg(ff1bEx2: GFP) embryos were (A–A′′) uninjected (control), (B–B′′) injected with tnnt2aMO, or (C–C′′) treated with 6 mM 2,3-BDM from 1.5 dpf. Embryos were harvested at 2.5 dpf and assayed for expression of GFP (green), Fn (red), and pFak (blue in A–C and A′–C′; white in A′′–C′′). Images are single confocal planes showing the maximal transverse dimension of ff1bGFP-expressing steroidogenic tissue of a representative embryo, with magnified views shown in (A′′–C′′). (D) Fluorescence intensity of Fn in the DA and IRV selected as regions of interest (ROI; white lines in A′–C′) normalized to the size of the ROI. (E) Total fluorescence intensities of pFak within the steroidogenic tissue (ROI marked by orange lines in A′′–C′′) were normalized to the size of the cluster. The difference between the treatment and the control groups was analyzed by Student′s t-test. ***P<0.001, N.S., not significant. D, dorsal; V, ventral; L, left; R, right. Abbreviations: arbitrary units (A.U.), interrenal tissue (IR), notochord (NC), somite (S), swim bladder (SB). Scale bar, 25 µm. |
| Gene: | |
|---|---|
| Fish: | |
| Condition: | |
| Knockdown Reagent: | |
| Anatomical Term: | |
| Stage: | Pec-fin |