
Fig. 2
- ID
- ZDB-FIG-150422-32
- Publication
- Stooke-Vaughan et al., 2015 - Otolith tethering in the zebrafish otic vesicle requires Otogelin and α-Tectorin
- Other Figures
- All Figure Page
- Back to All Figure Page
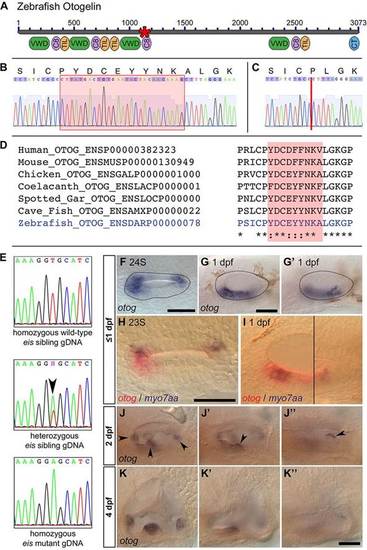
The eis mutation corresponds to a lesion in otog. (A) Overview of Otogelin protein structure based on available sequence data; the N terminus is likely to be incomplete. The asterisk indicates the predicted in-frame deletion in the eiste296f allele. VWD, Von Willebrand factor type D domain; C8, domain containing eight conserved cysteine residues; TIL, trypsin inhibitor-like cysteine-rich domain; CT, C-terminal cysteine knot-like domain. (B) Pooled wild-type (strain LWT) cDNA sequence data and predicted amino acid translation covering the region of otog that is mutated in eiste296f. The red box indicates the sequence deleted in eiste296f. (C) Pooled eiste296f cDNA from the same region as shown in B. The deletion is indicated by a vertical red line. (D) Clustal 2.1 multiple sequence alignment of the region of Otogelin deleted in the eiste296f allele. The nine amino acids deleted in eiste296f are highly conserved across vertebrates (shading). (E) gDNA sequence data from wild-type sibling, eiste296f heterozygous sibling and homozygous mutant embryos, confirming the T-to-A transversion identified by HMFseq (arrowhead indicates the double peak in the heterozygous embryo). (F-G2) Dorsal (F, 24S) and lateral (G,G2, 1dpf) views of a wild-type OV (dotted outline), showing that otog mRNA expression is not restricted to the tether cells. (G,G′) Different focal planes of the same OV. Anterior is to left. (H) Dorsal view of 23S wild-type OV; anterior to left. Expression of otog mRNA (red) includes the tether cells (marked by myo7aa, blue) and other cells at the poles of the OV. (I) Lateral view of 1dpf wild-type OV. Two focal planes are combined (black line marks the join), showing the anterior macula (left) and the posterior macula (right). otog (red) is expressed in hair cells (myo7aa positive, blue) and surrounding epithelial cells. (J-J3) Lateral view of different focal planes of the same 2dpf wild-type OV, showing expression of otog in the cristae (J, arrowheads), at the posterior of the anterior macula (J′, arrowhead) and along the dorsal edge of the posterior macula (J′′, arrowhead). (K-K′′) At 4dpf, otog is still expressed in the cristae, but expression is now very weak in the maculae (the apparent macula stain in K2 is out-of-focus staining in the lateral crista). Scale bars: 50µm. |