
Fig. 6
- ID
- ZDB-FIG-150313-39
- Publication
- Presslauer et al., 2014 - Induced Autoimmunity against Gonadal Proteins Affects Gonadal Development in Juvenile Zebrafish
- Other Figures
- All Figure Page
- Back to All Figure Page
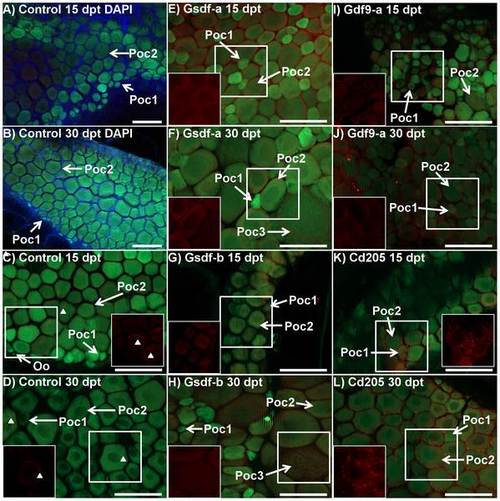
Immunhistochemistry of BcI2-interacting-killer (Bik) protein in control and treated ovaries of tg(vas::egfp) line zebrafish. Merged images combine the eGFP filter (green; germ cell lineage), dsRed filter (red; Bik protein), and DAPI filter (blue; somatic cells) under epifluorescent light. A and B) Control fish at 15 (72.3 mg, 20.5 mm) and 30 (108.4 mg, 25.6 mm) days post treatment (dpt), respectively: DAPI staining (blue) identifies somatic cells which fill the space between stage 1 and stage 2 primary oocytes (green) and around the periphery. C and D) Control fish at 15 and 30 dpt, respectively (A: 57.9 mg, 20.0 mm, B: 184.9 mg, 26.9 mm): Ovaries consisted of stage 1 and stage 2 primary oocytes with some oogonia. Very weak Bik signal was detected in some primary oocytes and some unidentified somatic cells (arrowheads) in only some samples. E and F) Anti-Gsdf-a treated fish at 15 and 30 dpt, respectively (E: 80.0 mg, 22.0 mm, F: 126.0 mg, 25.2 mm): Bik signal was detected in stage 2 primary oocytes but not in stage 1 cells, which were undetectable using only the dsRed filter (in box). Some stage 3 previtellogenic oocytes were seen. G and H) Anti-Gsdf-b treated fish at 15 and 30 dpt, respectively (G: 26.8 mg, 15.0 mm, H: 98.7 mg, 23.8 mm): Bik signal was detected in stage 2 primary and stage 3 previtellogenic oocytes. I and J) Anti-Gdf9-a treated fish at 15 and 30 dpt, respectively (I: 48.5 mg, 19.7 mm, J: 73.9 mg, 21.8 mm): the ovary consisted of presumptive stage 1 and 2 primary oocytes with a scattered distribution. Bik signal was detected in oocytes from both stages (in box). K and L) Anti-Cd205 treated fish at 15 and 30 dpt, respectively (K: 72.8 mg, 21.1 mm, L: 190.8 mg, 29.0 mm): Bik signal was detected in both germ cells and supporting somatic cells surrounding stage 1 and stage 2 primary oocytes. The signal in somatic cells was particularly strong. White boxes identify area being shown with dsRED filter only. Poc1 – stage 1 primary oocyte, Poc2 – stage 2 primary oocyte, Oo – oogonia, Poc3 – stage 3 previtellogenic oocyte. All scalebars represent 100 µm. |