
- Title
-
Induced Autoimmunity against Gonadal Proteins Affects Gonadal Development in Juvenile Zebrafish
- Authors
- Presslauer, C., Nagasawa, K., Dahle, D., Babiak, J., Fernandes, J.M., Babiak, I.
- Source
- Full text @ PLoS One
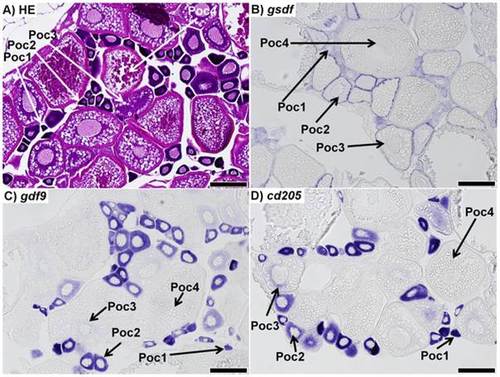
Sections of ovaries from 7 month-old zebrafish. A) Representative haematoxylin-eosin (HE) staining of the mature zebrafish ovary. B) in situ hybridization (ISH) of gsdf transcripts in the ovary; staining shows gsdf transcripts are localized in somatic cells surrounding primary oocytes. The staining is strongest in stage 2 primary oocytes (Poc2) and previtellogenic oocytes (Poc3). C) ISH of gdf9 transcripts in the ovary; strong signal is detected in stage 1 and 2 primary oocytes (Poc1 and Poc2). Weak signal is detected in previtellogenic oocytes (Poc3), while no signal was detected in vitellogenic oocytes (Poc4). D) ISH of cd205 transcripts in the ovary; strong signal is detected in stage 1 and 2 primary oocytes, with weak signal in previtellogenic oocytes, and no transcript detected in vitellogenic oocytes. All scalebars represent 200 µm. |
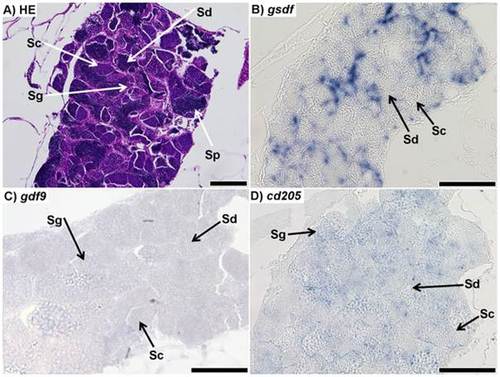
Sections of testis from 7 month-old zebrafish. A) Respresentative haematoxylin-eosin (HE) staining of the mature zebrafish testis; spermatogonia (Sg), spermatocytes (Sc), spermatids (Sd), and spermatozoa (Sp) could all be positively identified. B) in situ hybridization (ISH) of gsdf transcripts in the testis; staining shows strong signal throughout the testis, although it is unclear from which cell type it originates; no staining is visible in spermatocytes or spermatids. Spermatogonia and spermatozoa could not be identified. C) ISH of gdf9 transcripts in testis; faint signal was found throughout the testis. It is unclear which cell types the signal is localized to. D) ISH of cd205 transcripts in the testis; the signal is strongest in spermatogonia, while it is not visible in spermatocytes or spermatids. Spermatozoa could not be identified. All scalebars represent 100 µm. |
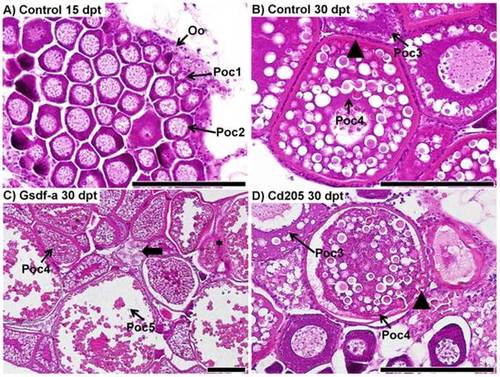
Histological comparison of ovary development in control and experimental fish. A) A representative ovary from a control fish (36.8 mg, 17.2 mm) at 15 days post treatment (dpt); primary oocytes at stage 2 (Poc2) are located predominantly in the center, whereas primary oocytes at stage 1 (Poc1) and oogonia (Oo) are located in the periphery of the ovary. B) A representative ovary from a control fish (216.0 mg, 29.9 mm) at 30 dpt; stage 4 vitellogenic primary oocytes (Poc4) have a thick zona radiata (arrowhead) surrounded by an even layer of follicular cells. Stage 3 previtellogenic primary oocytes lack the thick zona radiata. C) Ovary from an anti-Gsdf-a treated fish at 30 dpt (326.3 mg, 31.9 mm): stage 4 and 5 (Poc5) primary oocytes weredeveloped. An atretic oocyte is identified by the thick arrow. Granulomatous inflammatory reaction as a consequence of invasion of peritonial cells is identified by the black star. D) Ovary from an anti-Cd205 treated fish at 30 dpt (241.0 mg, 30.5 mm): zona radiata is apparently thinner than in controls, and some invaginations are evident (arrowhead), indicating the onset of the atresia process. An irregular follicular layer also indicates atresia (thick arrow). Scalebars represent 100 µm. |
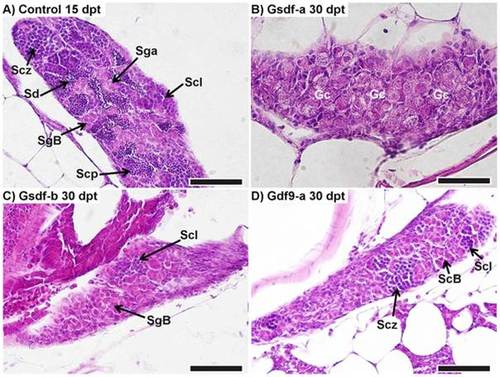
Retardation in testis development. A) Representation of normally developing testis in a control male (78.0 mg, 21.5 mm) at 15 days post treatment (dpt). B) Retarded development in an anti-Gsdf-a treated male at 30 dpt (132.0 mg, 25.5 mm): initial phase of differentiation with only undifferentiated gonocytes visible. C) Testis of an anti-Gsdf-b treated fish at 30 dpt (108.5 mg, 24.0 mm): the testis consisted predominantly of spermatogonia with the start of the spermatocyte phase visible. D) Testis of an anti-Gdf9-a treated fish at 30 dpt (89.4 mg, 22.4 mm): spermatocytes reached the zygotene stage of meiotic prophase. SgA – spermatogonia type A, SgB – spermatogonia type B, Scl – spermatocytes, leptotene of meiotic prophase, Scz – spermatocytes, zygotene of meiotic prophase, Scp – spermatocytes at pachytene stage, Sd – spermatids, Gc – undifferentiated gonocytes. All scalebars represent 50 µm. |
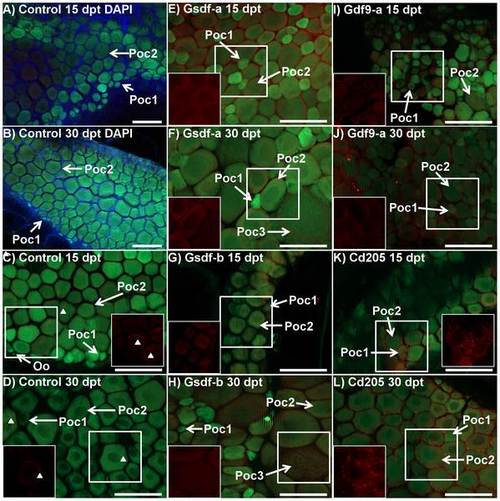
Immunhistochemistry of BcI2-interacting-killer (Bik) protein in control and treated ovaries of tg(vas::egfp) line zebrafish. Merged images combine the eGFP filter (green; germ cell lineage), dsRed filter (red; Bik protein), and DAPI filter (blue; somatic cells) under epifluorescent light. A and B) Control fish at 15 (72.3 mg, 20.5 mm) and 30 (108.4 mg, 25.6 mm) days post treatment (dpt), respectively: DAPI staining (blue) identifies somatic cells which fill the space between stage 1 and stage 2 primary oocytes (green) and around the periphery. C and D) Control fish at 15 and 30 dpt, respectively (A: 57.9 mg, 20.0 mm, B: 184.9 mg, 26.9 mm): Ovaries consisted of stage 1 and stage 2 primary oocytes with some oogonia. Very weak Bik signal was detected in some primary oocytes and some unidentified somatic cells (arrowheads) in only some samples. E and F) Anti-Gsdf-a treated fish at 15 and 30 dpt, respectively (E: 80.0 mg, 22.0 mm, F: 126.0 mg, 25.2 mm): Bik signal was detected in stage 2 primary oocytes but not in stage 1 cells, which were undetectable using only the dsRed filter (in box). Some stage 3 previtellogenic oocytes were seen. G and H) Anti-Gsdf-b treated fish at 15 and 30 dpt, respectively (G: 26.8 mg, 15.0 mm, H: 98.7 mg, 23.8 mm): Bik signal was detected in stage 2 primary and stage 3 previtellogenic oocytes. I and J) Anti-Gdf9-a treated fish at 15 and 30 dpt, respectively (I: 48.5 mg, 19.7 mm, J: 73.9 mg, 21.8 mm): the ovary consisted of presumptive stage 1 and 2 primary oocytes with a scattered distribution. Bik signal was detected in oocytes from both stages (in box). K and L) Anti-Cd205 treated fish at 15 and 30 dpt, respectively (K: 72.8 mg, 21.1 mm, L: 190.8 mg, 29.0 mm): Bik signal was detected in both germ cells and supporting somatic cells surrounding stage 1 and stage 2 primary oocytes. The signal in somatic cells was particularly strong. White boxes identify area being shown with dsRED filter only. Poc1 – stage 1 primary oocyte, Poc2 – stage 2 primary oocyte, Oo – oogonia, Poc3 – stage 3 previtellogenic oocyte. All scalebars represent 100 µm. |
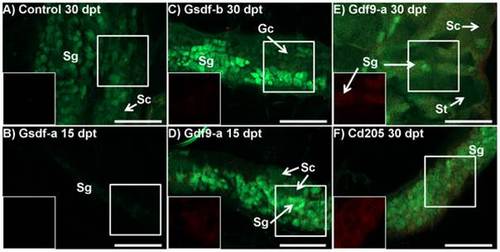
Immunohistochemistry of BcI2-interacting-killer (Bik) protein in testes of control and treated zebrafish of the tg(vas::egfp) line. Merged images combine the eGFP filter (green; germ cell lineage), and dsRed filter (red; Bik protein) under epifluorescent light. A) Control fish 30 days post treatment (dpt) (D; 59.3 mg, 21.3 mm): only a few small points of Bik signal were detected. The cell lineage from which the signal originates could not be determined. The testes were developing normally with clusters of spermatogonia (sg) and spermatocytes (sc) visible. B) Anti-Gsdf-a treated fish 15 dpt (27.3 mg, 16.0 mm): The testis was extremely early in development with only a few spermatogonia expressing weak eGFP signal. No Bik signal was detected. C) Anti-Gsdf-b treated fish 30 dpt (86.4 mg, 23.4 mm): Only a very weak Bik signal is detected in the testes. Only presumptive spermatogonia (sg) and undifferentiated gonocytes (gc) were identified. D and E) Anti-Gdf9-a treated fish at 15 and 30 dpt, respectively (D: 46.2 mg, 20.3 mm, E: 138.7 mg, 26.5 mm): Bik signal was localized to clusters of spermatogonia. In contrast, the clusters of spermatocytes (sc) and spermatids (st) did not show Bik signal. F) Anti-CD205 treated fish at 30 dpt (128.4 mg, 25.1 mm): a strong Bik signal was detected throughout the testis. However, resolution was insufficient to determine from which cell types it originated. All scalebars represent 100 µm. White boxes identify area being shown with dsRed filter only. |