
Fig. 4
- ID
- ZDB-FIG-150313-37
- Publication
- Presslauer et al., 2014 - Induced Autoimmunity against Gonadal Proteins Affects Gonadal Development in Juvenile Zebrafish
- Other Figures
- All Figure Page
- Back to All Figure Page
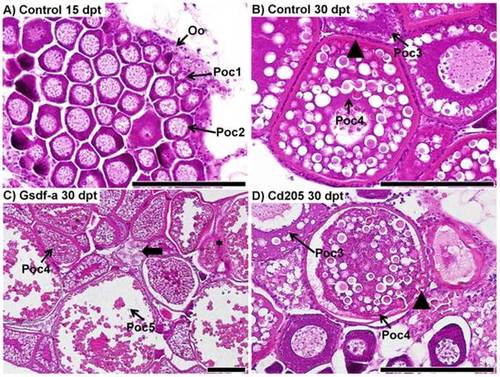
Histological comparison of ovary development in control and experimental fish. A) A representative ovary from a control fish (36.8 mg, 17.2 mm) at 15 days post treatment (dpt); primary oocytes at stage 2 (Poc2) are located predominantly in the center, whereas primary oocytes at stage 1 (Poc1) and oogonia (Oo) are located in the periphery of the ovary. B) A representative ovary from a control fish (216.0 mg, 29.9 mm) at 30 dpt; stage 4 vitellogenic primary oocytes (Poc4) have a thick zona radiata (arrowhead) surrounded by an even layer of follicular cells. Stage 3 previtellogenic primary oocytes lack the thick zona radiata. C) Ovary from an anti-Gsdf-a treated fish at 30 dpt (326.3 mg, 31.9 mm): stage 4 and 5 (Poc5) primary oocytes weredeveloped. An atretic oocyte is identified by the thick arrow. Granulomatous inflammatory reaction as a consequence of invasion of peritonial cells is identified by the black star. D) Ovary from an anti-Cd205 treated fish at 30 dpt (241.0 mg, 30.5 mm): zona radiata is apparently thinner than in controls, and some invaginations are evident (arrowhead), indicating the onset of the atresia process. An irregular follicular layer also indicates atresia (thick arrow). Scalebars represent 100 µm. |