
Fig. 4
- ID
- ZDB-FIG-150310-12
- Publication
- Mandal et al., 2014 - Retinoic acid negatively regulates dact3b expression in the hindbrain of zebrafish embryos
- Other Figures
- All Figure Page
- Back to All Figure Page
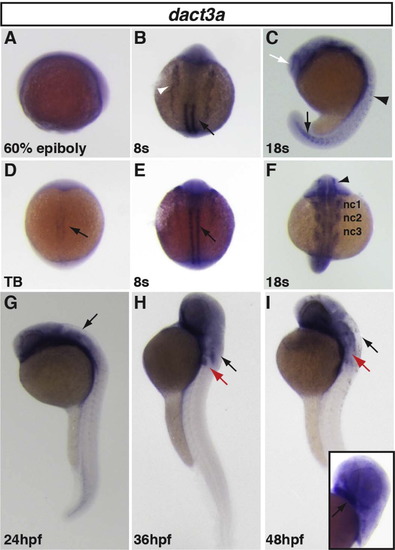
Zebrafish dact3a expression from 60% epiboly through 48 hpf. (A) Specific dact3a expression was not observed at 60% epiboly, even though it is detectable by RT-PCR ( Fig. 3). (D) Dact3a expression in the adaxial mesoderm at the TB stage (black arrow). (B,E) Dact3a expression in the somites (black arrows) and anterior lateral plate mesoderm (white arrowhead) at the 8s stage. (C) Expression at the telencephalon (white arrow), spinal cord neurons (black arrowhead), and the forming somites (black arrow) at the 18s stage. (F) Mandibular (nc1), hyoid (nc2), and branchial (nc3) neural crest expression and medial eye expression (black arrowhead) at the 18s stage. (G-I) Hindbrain expression at 24, 36 and 48 hpf (black arrow). At 36 and 48 hpf, dact3a expression is visible in the pectoral fin bud (red arrow). Inset: Cartilage expression (black arrow) at 48 hpf. A, C, G, H, I are lateral views. B, D, E, F are dorsal views. Anterior up in all the images. |
| Gene: | |
|---|---|
| Fish: | |
| Anatomical Terms: | |
| Stage Range: | Germ-ring to Long-pec |
Reprinted from Gene expression patterns : GEP, 16(2), Mandal, A., Waxman, J., Retinoic acid negatively regulates dact3b expression in the hindbrain of zebrafish embryos, 122-9, Copyright (2014) with permission from Elsevier. Full text @ Gene Expr. Patterns