
FIGURE
Fig. 3
- ID
- ZDB-FIG-150310-11
- Publication
- Mandal et al., 2014 - Retinoic acid negatively regulates dact3b expression in the hindbrain of zebrafish embryos
- Other Figures
- All Figure Page
- Back to All Figure Page
Fig. 3
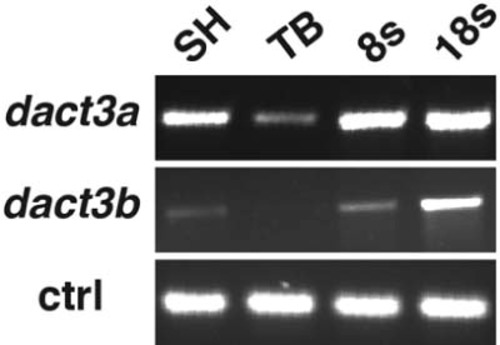
RT-PCR analysis of dact3a and dact3b gene expression. Expression of dact3a and dact3b analyzed by RT-PCR at the indicated stages. Solo served as a positive control. |
Expression Data
| Genes: | |
|---|---|
| Fish: | |
| Anatomical Term: | |
| Stage Range: | Shield to 14-19 somites |
Expression Detail
Antibody Labeling
Phenotype Data
Phenotype Detail
Acknowledgments
This image is the copyrighted work of the attributed author or publisher, and
ZFIN has permission only to display this image to its users.
Additional permissions should be obtained from the applicable author or publisher of the image.
Reprinted from Gene expression patterns : GEP, 16(2), Mandal, A., Waxman, J., Retinoic acid negatively regulates dact3b expression in the hindbrain of zebrafish embryos, 122-9, Copyright (2014) with permission from Elsevier. Full text @ Gene Expr. Patterns