
Fig. 5
- ID
- ZDB-FIG-141027-4
- Publication
- Xu et al., 1994 - Spatially regulated expression of three receptor tyrosine kinase genes during gastrulation in the zebrafish
- Other Figures
- All Figure Page
- Back to All Figure Page
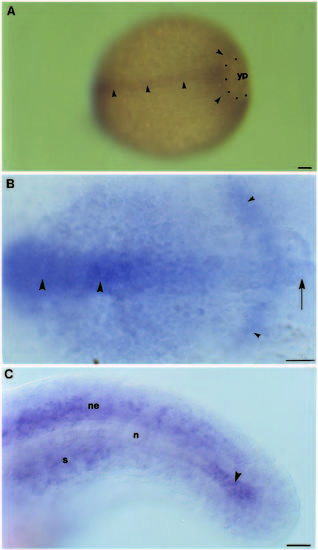
Expression of rtk2 during gastrulation. Whole-mounted embryos labelled with an antisense RNA probe to rtk2. Anterior is to the left. (A) 80-90% epiboly. rtk2 transcripts (arrowheads) are present along the entire axis and in cells surrounding the yolk cell. (B) Flat-mounted preparation of the presumptive head region at the end of epiboly. Slightly higher levels of rtk2 transcripts are present anteriorly (large arrowheads) than are present posteriorly (arrow) beneath the presumptive hindbrain. rtk2 expression is also apparent in lateral regions of the neural plate (small arrowheads). (C) 22 hour embryo. rtk2 expression is downregulated as the notochord differentiates but continues to be expressed in presumptive notochord cells of the extending tail bud. Transcripts are also present in the neural epithelium and in paraxial mesoderm (sectioned tissue suggests that this staining is in the sclerotome). Abbreviations: n, notochord; ne, neural epithelium; s, somite; yp, yolk plug. Scale bars: 50 µm. |
| Gene: | |
|---|---|
| Fish: | |
| Anatomical Terms: | |
| Stage Range: | 75%-epiboly to 26+ somites |