
Fig. 3
- ID
- ZDB-FIG-141027-2
- Publication
- Xu et al., 1994 - Spatially regulated expression of three receptor tyrosine kinase genes during gastrulation in the zebrafish
- Other Figures
- All Figure Page
- Back to All Figure Page
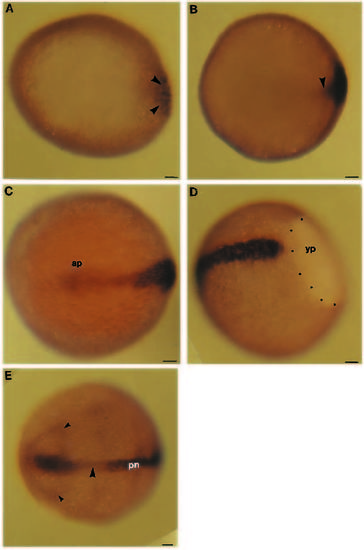
Expression of rtk1 during gastrulation. Wholemounted embryos labelled with an antisense RNA probe to rtk1. Viewed from animal pole (except D) with the future anterior end of the embryo to the left. (A) 50% epiboly. Transcripts (arrowheads) are detected at a restricted region of the germ ring. (B) 50-60% epiboly. Transcripts begin to accumulate along the developing axis of the embryo (arrowhead). (C,D) 75-85% epiboly. Transcripts are detectable along the elongating axis. Labelling at the animal pole in C is out of the plane of focus of the photograph. In D, the embryo is tilted to show the relationship of rtk1 transcripts to the yolk cell. (E) 100% epiboly. Transcripts are still detectable along the entire axis but labelling intensity is much reduced at the level of the future midbrain/anterior hindbrain (large arrowhead). The small arrowheads indicate transcripts within the neural plate. Abbreviations: ap, animal pole; pn, presumptive notochord; yp, yolk plug. Scale bars: 50 µm. |
| Gene: | |
|---|---|
| Fish: | |
| Anatomical Terms: | |
| Stage Range: | Shield to Bud |