
FIGURE
Fig. 2
- ID
- ZDB-FIG-140917-9
- Publication
- Wu et al., 2014 - Kcnq1-5 (Kv7.1-5) potassium channel expression in the adult zebrafish
- Other Figures
- All Figure Page
- Back to All Figure Page
Fig. 2
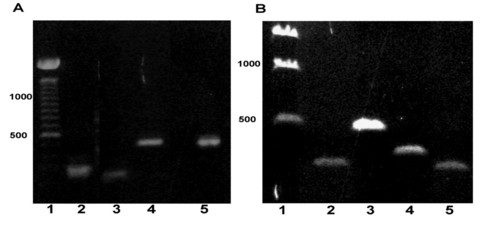
qRTPCR of Kcnq channel transcripts in brain, heart, and ear. Real time PCR thresholds (Delta CT) were first normalized to GAPDH or β-actin for each tissue. These data were then plotted relative to the lowest expressed mRNA in each tissue using a logarithmic scale. Depicted also is +/-1.0 standard error. |
Expression Data
| Genes: | |
|---|---|
| Fish: | |
| Anatomical Terms: | |
| Stage: | Adult |
Expression Detail
Antibody Labeling
Phenotype Data
Phenotype Detail
Acknowledgments
This image is the copyrighted work of the attributed author or publisher, and
ZFIN has permission only to display this image to its users.
Additional permissions should be obtained from the applicable author or publisher of the image.
Full text @ BMC Physiol.