
Fig. 6
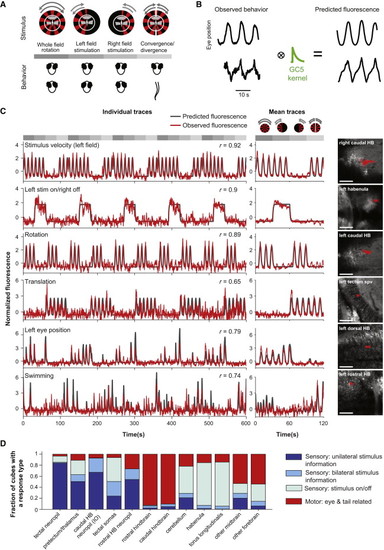
Sensory and Motor Signals Are Reflected in the Measured Activity (A) Four stimuli were used to separate different sensorimotor signals: the standard rotating grating, rotating gratings presented on the left or right visual fields alone, and gratings rotating in opposite directions for each eye, to simulate forward and backward motion. Top: visual stimuli. Bottom: schematic of the behavior (eye rotation or tail movements) elicited. See also Figure S1B. Gray shades indicate the four stimuli periods. (B) Behavioral and stimulus-related variables were convolved with an exponential kernel using the decay time constant of GCaMP5G (Chen et al., 2013b). These convolved traces represented the predicted fluorescence that would be recorded if activity was related to each of those variables (see Experimental Procedures and Miri et al., 2011b). See also Figure S4. (C) ROI activity is strongly correlated with the predicted fluorescence for different behavioral variables (regressors). For each example ROI, the fluorescence trace and the predicted fluorescence for the regressor with the highest correlation are shown. Left: normalized (Z score) fluorescence traces for a subset of stimulus repetitions, and the corresponding normalized (Z score) behavioral trace. The correlation coefficient is indicated. Center: normalized average fluorescence across stimulus repeats (and planes) for the ROI, with the corresponding normalized average behavioral trace. A schematic of the four stimuli is shown above the top center plot. Gray boxes indicate the duration of each of the four stimuli in all plots. Right: anatomical localization of the ROIs (red). See also Figures S5 and S6. Scale bars, 50 μm. (D) Sensory and motor variables are differentially represented in different brain areas. Fraction of cubes best correlated with different categories of regressors in different brain regions (best r > 0.3). Sensory variables were divided in three categories: one that included features related to stimulus motion, one that encompasses responses related to stimulus onset/offset, and another in which information was combined from the two eyes. Motor variables included those related to eye position or velocity and swimming. |