
FIGURE
Fig. 4
Fig. 4
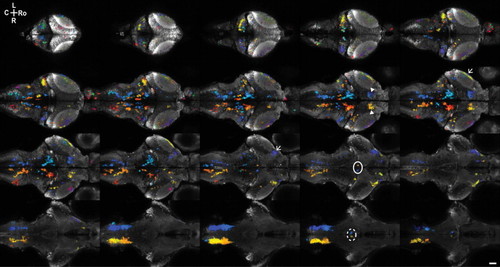
Averaging Raw Data from Morphed Brains Provides a Comprehensive Map of the Areas Active during Behavior Color-coded activity phase of ROIs segmented from volumetric imaging data averaged across three fish. ROIs are superimposed on average GCaMP5G fluorescence for anatomical reference. Average planes are shown at 10 μm intervals from a stack of 510 image planes with 0.5 μm z-separation. Features highlighted are the oculomotor nucleus (solid line), the interpeduncular nucleus/median raphe (dashed line), the pretectum (arrowheads), and retinal ganglion cell arborization fields (arrows). See also Movies S6 and S7. |
Expression Data
Expression Detail
Antibody Labeling
Phenotype Data
Phenotype Detail
Acknowledgments
This image is the copyrighted work of the attributed author or publisher, and
ZFIN has permission only to display this image to its users.
Additional permissions should be obtained from the applicable author or publisher of the image.
Full text @ Neuron