
Fig. 5
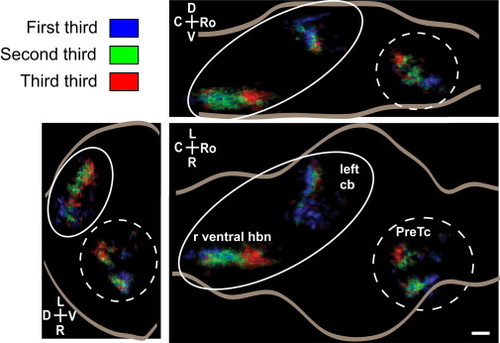
Spatial Gradients of Activity Timing Are Found in Various Brain Regions Voxels were color-coded blue, green, or red depending on whether they fell into the first, second, or third third of voxels active within that region; that is, in each region, blue voxels were active before green voxels, which in turn were active before the red ones. A caudal-to-rostral gradient of activity timing is visible in the cerebellum (cb) and ventral hindbrain (r ventral hbn; only left cerebellum and contralateral hindbrain are shown for simplicity [solid line]), whereas a rostral-to-caudal gradient is observed in the pretectum/thalamus region (PreTc; only right is shown [dashed line]). Regions circled together were analyzed together; activity in the cerebellum (cb) and the contralateral inferior olive and more rostral neuropil show simultaneous activity. Only the cerebellum and pretectal region are displayed in the coronal projection for simplicity. Data are the average of three fish, as in Figure 4. See also Movie S8. Scale bar, 50 μm. |