
Fig. S3
- ID
- ZDB-FIG-140506-75
- Publication
- Stewart et al., 2014 - Sequential and opposing activities of Wnt and BMP coordinate zebrafish bone regeneration
- Other Figures
- All Figure Page
- Back to All Figure Page
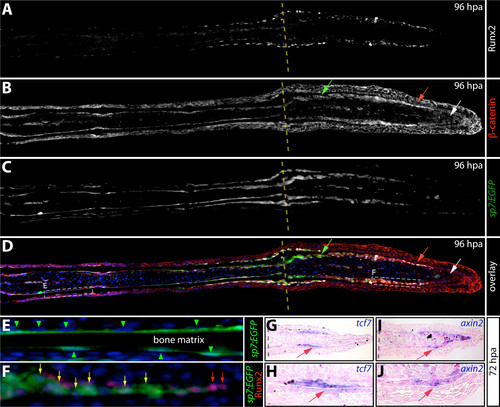
β-catenin localization in the osteoblast lineage during fin regeneration. (A-F) Stitched high-resolution widefield epifluorescence images of a fin section from a 4 dpa Tg(sp7:EGFP) fish immunostained to show Runx2 expression (A, white), β-catenin localization (B, red), and sp7:EGFP reporter activity (C, green). The overlay is shown in (D). Red arrows point to Runx2+ cells containing robust nuclear β-catenin, green arrows indicate sp7:EGFP+ with membrane associated β-catenin, and white arrows point to distal blastema cells with low nuclear β-catenin. The dashed yellow lines show the amputation site. (E, F) High magnification images of the regions bounded by the dashed white boxes in (D) to highlight cell shape in nonregenerating (E) vs. regenerating (F) osteoblasts. Green arrowheads indicate elongated nonregenerating sp7:EGFP+ epithelial osteoblasts. Red and yellow arrows indicate regenerating distal Runx2+ and Runx2+/sp7:EGFP+ cells, respectively, with distinctly rounded morphology. (G-J) Detection of tcf7 (G and H) and axin2 (I and J) expression by in situ hybridization on sections from 72 hpa fins at low (G and I) and high (H and J) magnification. Red arrows point to specific expression of axin2 and tcf7 in distal pre-osteoblasts. The grey dashed line indicates the site of amputation. Shown are representative images indicative of experiments repeated > 6 times. |