
Fig. S2
- ID
- ZDB-FIG-140506-74
- Publication
- Stewart et al., 2014 - Sequential and opposing activities of Wnt and BMP coordinate zebrafish bone regeneration
- Other Figures
- All Figure Page
- Back to All Figure Page
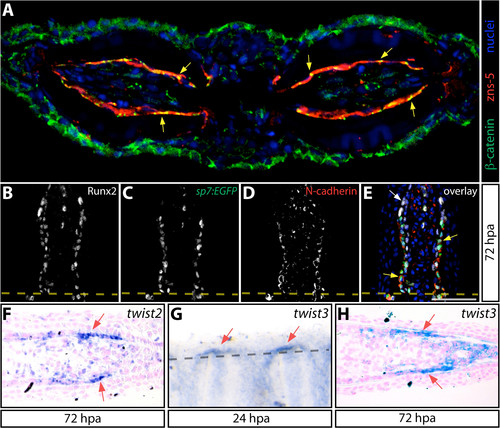
Dual epithelial/mesenchymal nature of osteoblasts during fin regeneration. (A) Immunostaining for the osteoblast lineage marker zns-5 (red) and β-catenin (green) on a transverse section from a non-regenerating fin. Hoechst-stained nuclei are shown in blue. Yellow arrows point to adherens junctions between β-catenin/zns-5 labeled osteoblasts. (B-E) Expression of Runx2 (B, in white), sp7:EGFP (C, in green), and N-cadherin (D, in red) are shown in overlay (E) on 72 hpa fin sections. The white arrow points to distal Runx2+ preosteoblasts lacking N-cadherin expression and yellow arrows indicate sp7+ maturing osteoblasts that display membrane-localized N-cadherin. The yellow dashed line indicates the amputation plane and the scale bar represents 50 μm. (F) Expression of twist2 mRNA (in blue) using in situ hybridization on 72 hpa fin paraffin sections. Red arrows point to distal pre-osteoblasts expressing twist2. (G and H) In situ hybridization to localize expression of twist3 on wholemount fins at 24 hpa. (G) and paraffin sections of 72 hpa fins (H). In (G), red arrows point to cells expressing twist3 (in blue) distal to the amputation site (grey dashed arrow). In (H), red arrows point to distal pre-osteoblasts exhibiting twist3 expression (in blue). Shown are representative images from experiments repeated > 3 times. |