
Fig. 2
- ID
- ZDB-FIG-140422-11
- Publication
- Yamanaka et al., 2014 - In vitro analysis suggests that difference in cell movement during direct interaction can generate various pigment patterns in vivo
- Other Figures
- All Figure Page
- Back to All Figure Page
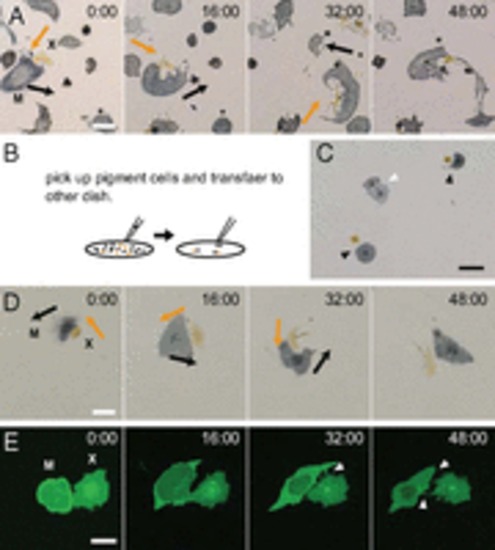
Dynamic interactions between a melanophore and a xanthophore. (A) Cell interactions between a melanophore and a xanthophore. The xanthophore extended pseudopodia to the melanophore. The melanophore then moved away from the pseudopodia, and the xanthophore chased the melanophore. Arrows indicate the directions of cell movements. (B) A schematic diagram describing the manipulation of pigment cells. (C) Transferred pigment cells. Black arrowheads indicate pairs of melanophores and xanthophores. The white arrowhead indicates a pair of melanophores. (D) Interactions between a melanophore and a xanthophore. The transferred pigment cells exhibit interactions that are similar to the interactions observed in a mixed culture. Arrows indicate the directions of cell movements. (E) Interactions of a xanthophore and a melanophore-expressing membrane-targeting EGFP. A xanthophore extended pseudopodia to a melanophore during interaction, and pseudopodia kept contact with the surface of the melanophore. White arrowheads indicate the pseudopodia of the xanthophore. M, melanophore; X, xanthophore. (Scale bar, A, D, and E, 50 μm; C, 100 μm.) |