
- Title
-
In vitro analysis suggests that difference in cell movement during direct interaction can generate various pigment patterns in vivo
- Authors
- Yamanaka, H., and Kondo, S.
- Source
- Full text @ Proc. Natl. Acad. Sci. USA
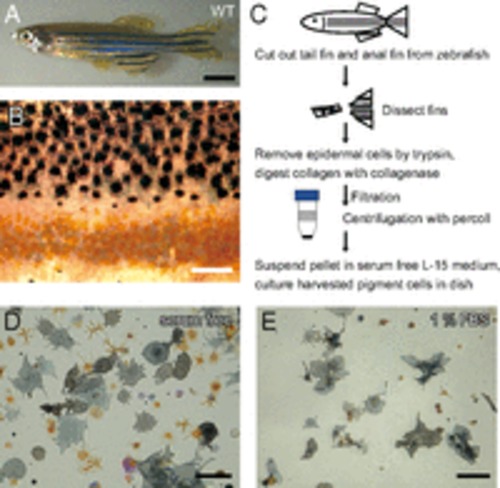
Harvesting pigment cells from zebrafish fins. (A) Adult WT zebrafish. (B) Magnified image of the surface of a WT fish body. Black spots are melanophores, and yellow spots are xanthophores. Clear gaps exist between the regions containing melanophores and the regions containing xanthophores. (C) A schematic diagram describing the harvest of pigment cells from fins. (D and E) The effect of serum in the medium on cell spreading. Cell pellets were suspended in (D) serum-free L15 medium or (E) medium containing 1% FBS. (Scale bars: A, 5.0 mm; B, D, and E, 100 μm.) |
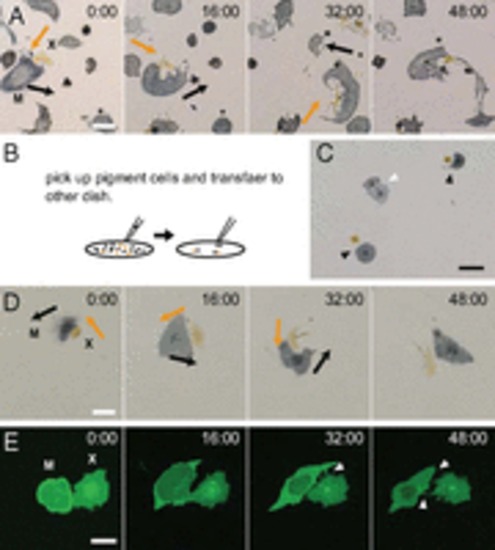
Dynamic interactions between a melanophore and a xanthophore. (A) Cell interactions between a melanophore and a xanthophore. The xanthophore extended pseudopodia to the melanophore. The melanophore then moved away from the pseudopodia, and the xanthophore chased the melanophore. Arrows indicate the directions of cell movements. (B) A schematic diagram describing the manipulation of pigment cells. (C) Transferred pigment cells. Black arrowheads indicate pairs of melanophores and xanthophores. The white arrowhead indicates a pair of melanophores. (D) Interactions between a melanophore and a xanthophore. The transferred pigment cells exhibit interactions that are similar to the interactions observed in a mixed culture. Arrows indicate the directions of cell movements. (E) Interactions of a xanthophore and a melanophore-expressing membrane-targeting EGFP. A xanthophore extended pseudopodia to a melanophore during interaction, and pseudopodia kept contact with the surface of the melanophore. White arrowheads indicate the pseudopodia of the xanthophore. M, melanophore; X, xanthophore. (Scale bar, A, D, and E, 50 μm; C, 100 μm.) |

Interactions among pigment cells from jaguar. (A) The appearance of a jaguar mutant, which has wild and fuzzy stripes. (B) Magnified image of the surface of jaguar. Xanthophores and melanophores intermingle in the border region. (C) The migration profile of jaguar xanthophores interacting with jaguar melanophores. The mean scalar speed of xanthophores was 1.01 μm/h. (D) The migration profile of jaguar melanophores interacting with jaguar xanthophores. The mean scalar speed of xanthophores was 2.02 μm/h. (E) Merged movements of jaguar xanthophores and jaguar melanophores. (F) The migration profile of jaguar xanthophores interacting with WT melanophores. The mean scalar speed of xanthophores was 1.91 μm/h. (G) The migration profile of WT melanophores interacting with jaguar xanthophores. The mean scalar speed of melanophores was 2.57 μm/h. (H) Merged movements of jaguar xanthophores and WT melanophores. (I) The migration profile of WT xanthophores interacting with jaguar melanophores. The mean scalar speed of xanthophores was 1.17 μm/h. (J) The migration profile of jaguar melanophores interacting with WT xanthophores. The mean scalar speed of melanophores was 1.79 μm/h. (K) Merged movements of interacting WT xanthophores and jaguar melanophores. (Scale bar: A, 5.0 mm; B, 100 μm.) |

Interactions among leopard pigment cells. (A) The appearance of a leopard mutant, which has a spotted pattern. (B) Magnified image of the surface of leopard. Melanophores are surrounded by xanthophores, and the separation between them is clear. (C) The migration profile of leopard xanthophores interacting with leopard melanophores. The mean scalar speed of xanthophores was 1.29 μm/h. (D) The migration profile of leopard melanophores interacting with leopard xanthophores. The mean scalar speed of melanophores was 1.65 μm/h. (E) Merged movements of interacting leopard xanthophores and melanophores. (F) The migration profile of leopard xanthophores interacting with WT melanophores. The mean scalar speed of xanthophores was 1.16 μm/h. (G) The migration profile of WT melanophores interacting with leopard xanthophores. The mean scalar speed of melanophores was 2.46 μm/h. (H) Merged movements of interacting leopard xanthophores and WT melanophores. (I) The migration profile of WT xanthophores interacting with leopard melanophores. The mean scalar speed of xanthophores was 0.91 μm/h. (J) The migration profile of leopard melanophores interacting with WT xanthophores. The mean scalar speed of melanophores was 1.31 μm/h. (K) Merged movements of interacting WT xanthophores and leopard melanophores. (Scale bar: A, 5.0 mm; B, 100 μm.) |