
FIGURE
Fig. 2
- ID
- ZDB-FIG-140324-32
- Publication
- Annila et al., 2013 - ZebIAT, an image analysis tool for registering zebrafish embryos and quantifying cancer metastasis
- Other Figures
- All Figure Page
- Back to All Figure Page
Fig. 2
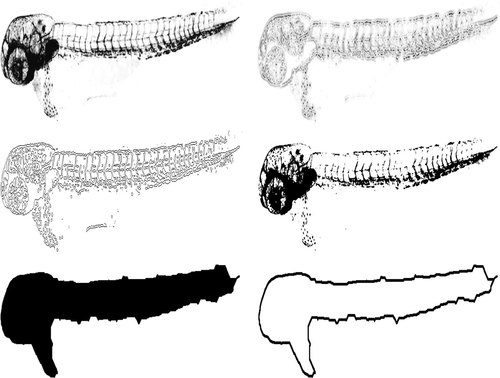
Segmentation procedure. Top left: Image from the green fluorescence channel. Top right: Image filtered with LoG. Middle left: Result from LoG edge detection. Middle right: Result from Otsu′s threshold. Bottom left: Segmented image after all steps, including morphological closing. Bottom right: Outline of the fish. For illustration purposes, the images are presented with inverted grayscale values. |
Expression Data
Expression Detail
Antibody Labeling
Phenotype Data
Phenotype Detail
Acknowledgments
This image is the copyrighted work of the attributed author or publisher, and
ZFIN has permission only to display this image to its users.
Additional permissions should be obtained from the applicable author or publisher of the image.
Full text @ BMC Bioinformatics