
- Title
-
ZebIAT, an image analysis tool for registering zebrafish embryos and quantifying cancer metastasis
- Authors
- Annila, T., Lihavainen, E., Marques, I.J., Williams, D.R., Yli-Harja, O., and Ribeiro, A.
- Source
- Full text @ BMC Bioinformatics
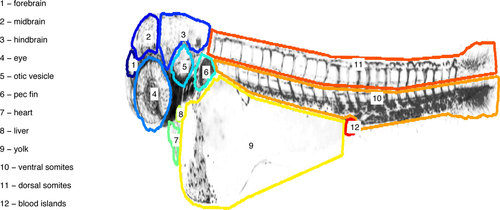
Example of a reference embryo, with organs marked. For easier visualization, only the borders of the masks of the organs are shown. |
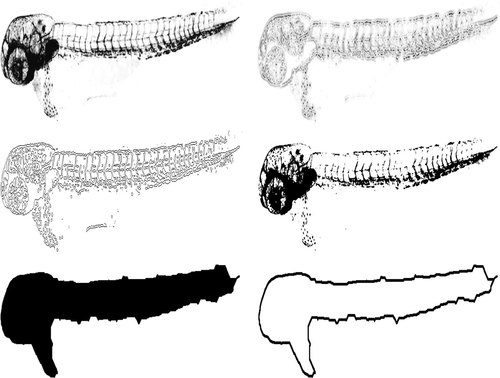
Segmentation procedure. Top left: Image from the green fluorescence channel. Top right: Image filtered with LoG. Middle left: Result from LoG edge detection. Middle right: Result from Otsu′s threshold. Bottom left: Segmented image after all steps, including morphological closing. Bottom right: Outline of the fish. For illustration purposes, the images are presented with inverted grayscale values. |
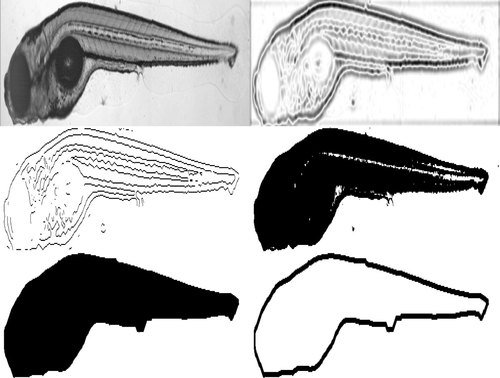
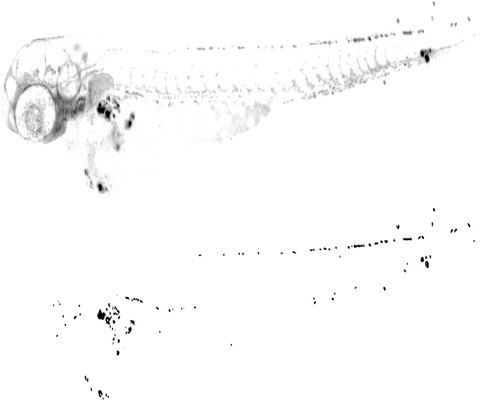
Segmentation of a DIC image. Top left: grayscale image with inverted grayscale values. Top right: Image filtered with LoG. Middle left: Result from LoG edge detection. Middle right: Result from Otsu′s threshold. Bottom left: Segmented image after all steps, including morphological closing. Bottom right: Outline of the fish. |
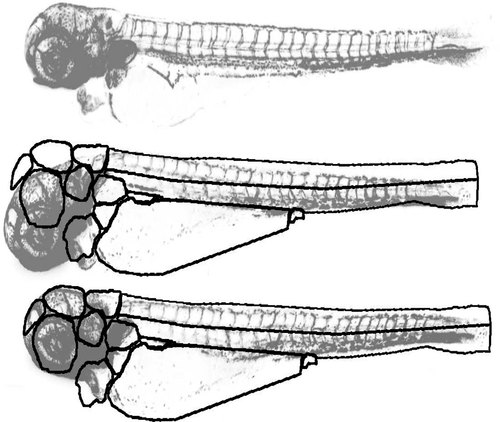
Registration procedure. Top: Reference fish with 1 day after injection of cancer cells. Middle: Fish to be registered. Bottom: Registered fish. For illustration purposes, the images are presented with inverted grayscale values. |
Spot detection. Top: red channel of the image. Bottom: segmented spots. Gamma correction was used in the two images to improve the visibility of the spots. For illustration purposes, the images are presented with inverted grayscale values. |