
Fig. 3
- ID
- ZDB-FIG-140317-3
- Publication
- He et al., 2013 - Microbial fingerprinting detects intestinal microbiota dysbiosis in Zebrafish models with chemically-induced enterocolitis
- Other Figures
- All Figure Page
- Back to All Figure Page
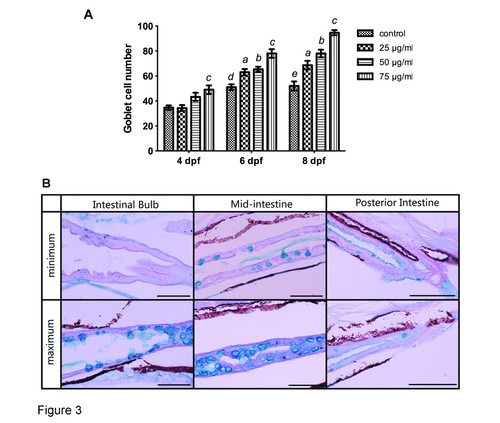
Quantification of goblet cells stained with Alcian blue and periodic acid Schiff reagent (AB–PAS). A: Goblet cell number increased with increasing concentrations of TNBS over time. All error bars represent as mean ± SEM. n=10 larvae per group, a Indicates a significant difference (p<0.05) between TNBS-exposed group (25 µg/ml) and the control, b Indicates a significant difference (p<0.05) between TNBS-exposed group (50 µg/ml) and the control, c Indicates a significant difference (p<0.05) between TNBS-exposed group (75 µg/ml) and the control, d Indicates a significant difference (p<0.05) between control groups at 6 dpf and 4 dpf, e Indicates a significant difference (p<0.05) between control groups at 8 dpf and 4 dpf. B: Representative pictures of maximum and minimum numbers of goblet cells in the intestinal bulb, the mid-intestine and the posterior intestine. Histochemical staining with AB-PAS demonstrates that goblet cells continue to synthesize acidic mucins. |
| Fish: | |
|---|---|
| Condition: | |
| Observed In: | |
| Stage Range: | Day 4 to Days 7-13 |