
Fig. 2
- ID
- ZDB-FIG-140317-2
- Publication
- He et al., 2013 - Microbial fingerprinting detects intestinal microbiota dysbiosis in Zebrafish models with chemically-induced enterocolitis
- Other Figures
- All Figure Page
- Back to All Figure Page
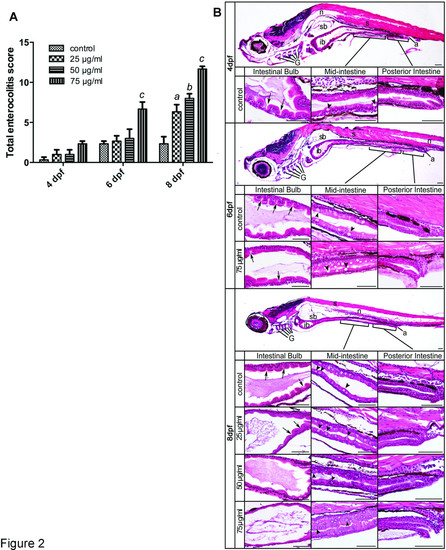
Histological analysis of TNBS-induced enterocolitis. A: Total enterocolitis score of larval zebrafish exposed to different TNBS concentrations (0, 25, 50 and 75 µg/ml) at 4, 6 and 8 dpf. The scores were quantified by a blinded scorer. For each score, a total of 30 folds (10 per intestinal segment) were evaluated per intestine and 6 intestines were evaluated for each experimental group from three independent experiments. All error bars represent as mean ± SEM. n=6 larvae per group, a Indicates a significant difference (p<0.05) between TNBS-exposed group (25 µg/ml) and the control, b Indicates a significant difference (p<0.05) between TNBS-exposed group (50 µg/ml) and the control, c Indicates a significant difference (p<0.05) between TNBS-exposed group (75 µg/ml) and the control, d Indicates a significant difference (p<0.05) between control groups at 6 dpf and 4 dpf, e Indicates a significant difference (p<0.05) between control groups at 8 dpf and 4 dpf. B: Representative haematoxylin-eosin stained sagittal sections of the whole intestine tact and regions of the intestinal bulb, the mid-intestine and the posterior intestine from the statistically significant groups taken at 4, 6 and 8 dpf. In the segment of the intestinal bulb (ib), the lumen expands and the depth of epithelial folds is progressively reduced during TNBS exposure (arrows). The mid-intestine is demarcated by the presence of goblet cells and shows increased numbers with TNBS treatment (arrowheads). No significant changes are shown in the posterior intestine region between control and TNBS-exposed samples. a, anus; ib, intestinal bulb; G, gill arches; L, liver; sb, swim bladder; n, notochord; s, somite. Scale bars, 50 µm. |
| Fish: | |
|---|---|
| Condition: | |
| Observed In: | |
| Stage Range: | Day 4 to Days 7-13 |