
|
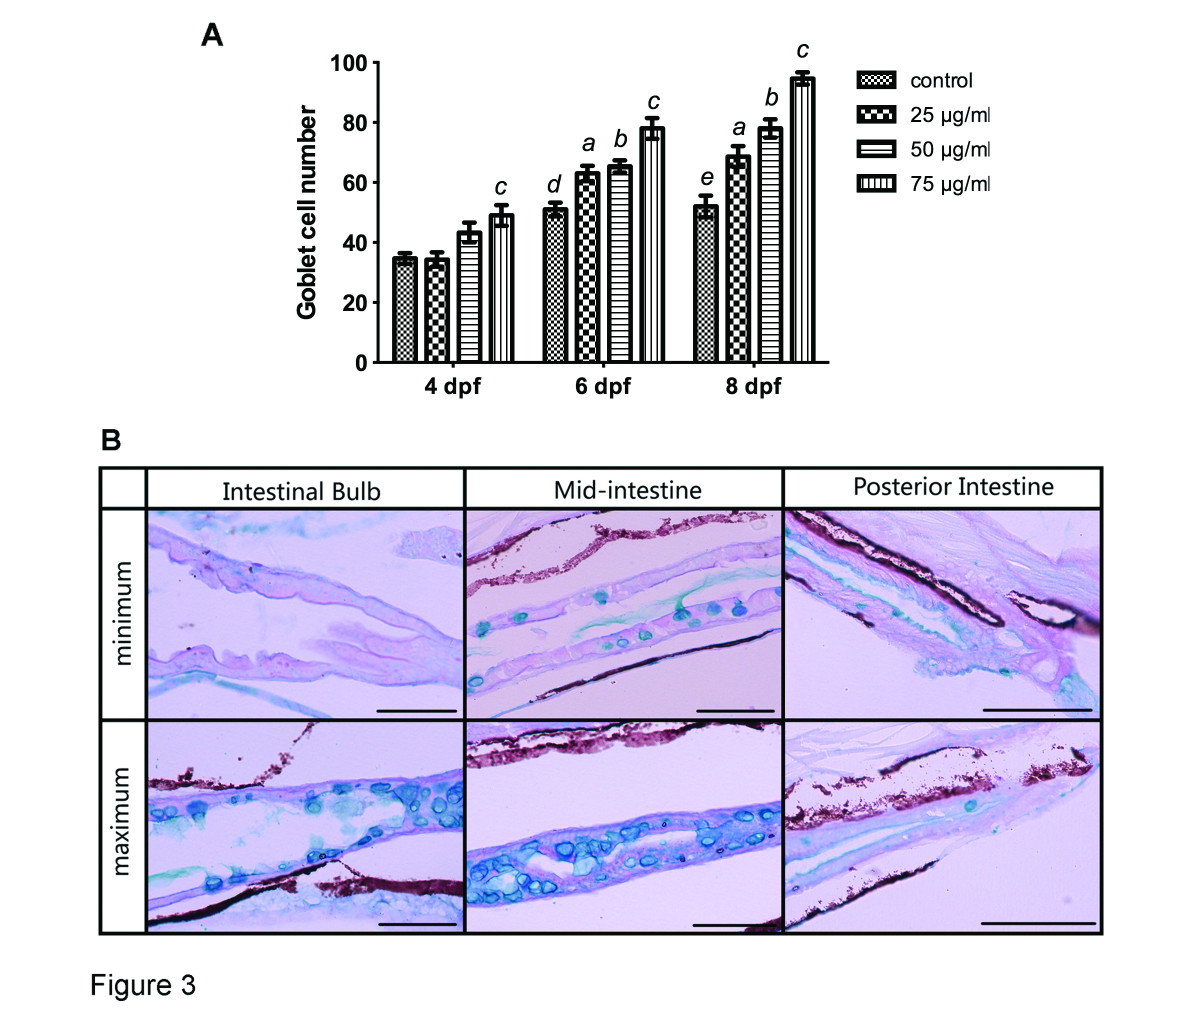
Fig. 3
Quantification of goblet cells stained with Alcian blue and periodic acid Schiff reagent (AB–PAS). A: Goblet cell number increased with increasing concentrations of TNBS over time. All error bars represent as mean ± SEM. n=10 larvae per group, a Indicates a significant difference (p<0.05) between TNBS-exposed group (25 µg/ml) and the control, b Indicates a significant difference (p<0.05) between TNBS-exposed group (50 µg/ml) and the control, c Indicates a significant difference (p<0.05) between TNBS-exposed group (75 µg/ml) and the control, d Indicates a significant difference (p<0.05) between control groups at 6 dpf and 4 dpf, e Indicates a significant difference (p<0.05) between control groups at 8 dpf and 4 dpf. B: Representative pictures of maximum and minimum numbers of goblet cells in the intestinal bulb, the mid-intestine and the posterior intestine. Histochemical staining with AB-PAS demonstrates that goblet cells continue to synthesize acidic mucins.