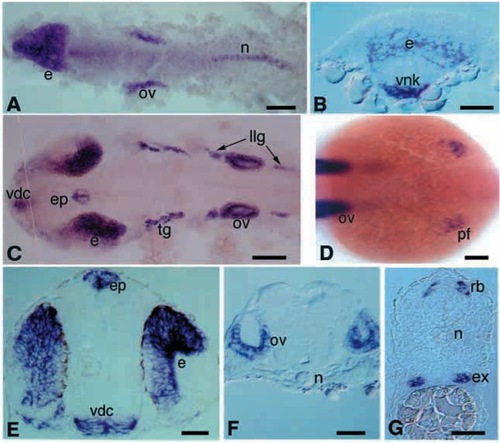
Expression pattern of tbx-c in the zebrafish embryo. (A) Dorsal view of a flat-mounted zebrafish embryo at 10 hpf. Note the expression in the anterior ventral neural keel, single eye field, the otic vesicle and the early notochord. (B) Transverse section of the 10 hpf embryo showing tbx-c transcripts in the eye field as well as in the anterior ventral neural keel. (C) Dorsal view showing expression of tbx-c at 20 hpf. The expression is localized to the ventral forebrain, the dorsal eye, the epiphysis, the trigeminal as well as lateral line ganglia and the otic vesicle. (D) Dorsal view of whole-mounted embryo (22 hpf) showing expression in pectoral fin buds and the otic vesicle. (E) Transverse section at the eye level shows tbx-c transcripts in the epiphysis, the ventral diencephalon and retinal cells in the dorsal eye. (F) Transverse section shows expression of tbx-c in the otic vesicle. (G) Transverse section through the caudal spinal cord shows expression of tbx-c in mechanosensory Rohon-Beard cells and in the excretory system. e, eye; ep, epiphysis; ex, excretory system; llg, lateral line ganglia; n, notochord; ov, otic vesicle; rb, Rohon-Beard cells; tg, trigeminal ganglion; vdc, ventral diencephalon; vnk, ventral neural keel. Anterior is at the left, unless otherwise stated. Scale bars, 100 μm (A), 50 μm (B-G).
|
