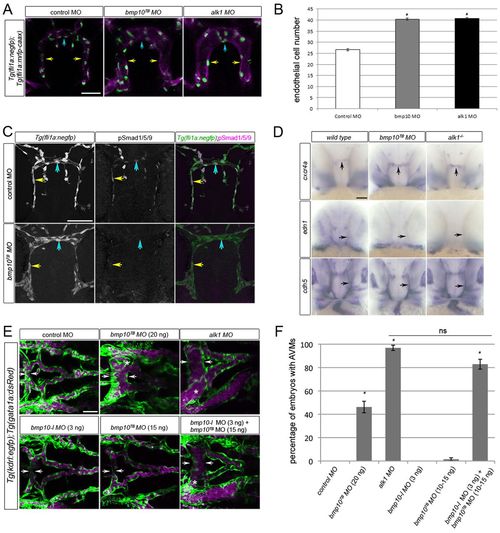
Knockdown of bmp10 phenocopies zebrafish alk1 mutants. (A) CaDIs (caudal divisions of the internal carotid artery; yellow arrows) and BCA (basal communicating artery; blue arrows) in 36 hpf Tg(fli1a:mrfp-caax);Tg(fli1a:negfp) embryos injected with 20 ng control, 20 ng bmp10TB or 2.5 ng alk1 morpholino. Endothelial cell membranes are magenta; nuclei are green. 2D projections of 10 optical sections (Z-step, 2 µm), frontal views, dorsal upwards. Scale bar: 50 μm. (B) Endothelial cell number in the CaDI/BCA in control, bmp10TB and alk1 morphants. n=7-10 in three independent experiments. Values are mean±s.e.m. Student’s t-test: *P<0.001. (C) pSmad1/5/9 (middle column) in endothelial cells (nuclei marked by fli1a:negfp transgene, left column) in 36 hpf control and bmp10TB morphants. In merge (right column), EGFP-expressing endothelial cell nuclei are green, pSmad1/5/9 immunofluorescence is magenta. Yellow and blue arrows indicate endothelial cells in the CaDI and BCA, respectively. 2D confocal projections of 50 μm frontal sections, dorsal upwards. Scale bar: 50 μm. See supplementary material Table S1 for fluorescence quantitation. (D) Whole-mount in situ hybridization for cxcr4a, edn1 and cdh5 (pan-endothelial control) in wild type/control morphant, bmp10TB morphant and alk1-/- at 36 hpf. Frontal views, dorsal upwards. Arrows indicate BCA (vertical) or CaDI (horizontal). Scale bar: 50 μm. (E) Cranial vasculature in 48 hpf Tg(kdrl:gfp);Tg(gata1a:dsRed) embryos injected with bmp10TB morpholino (15-20 ng, as indicated), alk1 morpholino (2.5 ng) and/or bmp10-like morpholino (3 ng). Arrows highlight width of BCA; asterisk indicates AVM. Endothelial cells are green, red blood cells magenta. 2D confocal projections, dorsal views, anterior leftwards. Scale bar: 50 μm. (F) Quantification of AVM development in 48 hpf morpholino-injected embryos. n=43-146. Values are mean±s.e.m. Student’s t-test: *P<0.001; ns, not significant.
|
