
Fig. 6
- ID
- ZDB-FIG-130815-18
- Publication
- Patterson et al., 2013 - Interactions with Iridophores and the Tissue Environment Required for Patterning Melanophores and Xanthophores during Zebrafish Adult Pigment Stripe Formation
- Other Figures
- All Figure Page
- Back to All Figure Page
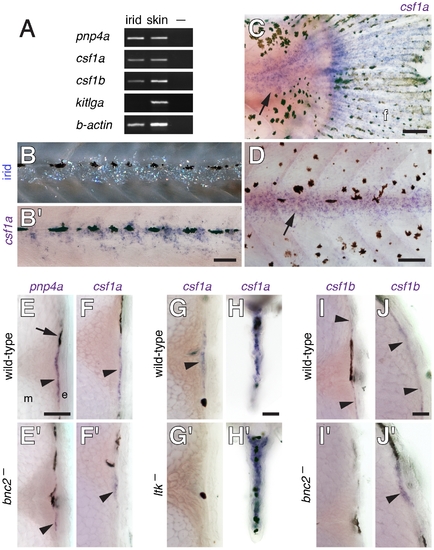
csf1a and csf1b were expressed by interstripe iridophores as well as hypodermal and fin cells. (A) RT-PCR of isolated iridophores (irid) and skin containing pigment cells for the iridophore marker pnp4a as well as csf1a, csf1b and kitlga. –, no template control. See text for details. (B) A larva (~6 SSL) imaged to show iridophores prior to fixation (upper) and after whole-mount staining for csf1a transcript. Not all iridophore reflecting platelets are visible and platelets that are apparent may not precisely delineate cell bodies and processes. (C,D) Whole-mount larvae (~8.5 SSL) stained for csf1a transcript. (C) csf1a was expressed in the posterior trunk at the base of the caudal fin (arrow) where a patch of posterior iridophores develops [45] and also within the fin (f). (D) csf1a staining near the horizontal myoseptum (arrow). (E–J) In situ hybridizations on vibratome cross-sections through the midtrunk (~7 SSL). (E,E2) pnp4a staining indicated iridophore locations (arrowheads) within the hypodermis of wild-type (bnc2/+) larvae (E) and revealed fewer of these cells in bnc2 mutants (E2). Arrow, melanophore. (F,F2) csf1a staining (arrowheads) was reduced in bnc2 mutants. (G–H) Staining for csf1a in wild-type (ltk/+) and ltk mutants, which lack iridophores. (G,G2) csf1a staining was absent in ltk mutants at the location where iridophores are found in the wild-type (arrowhead). (H,H2) In the fins, however, iridophore-independent csf1a expression was present in both wild-type and ltk mutant larvae. (I–J) csf1b expression was at the limit of detection by in situ hybridization. (I,I2) Along the lateral trunk, csf1b transcript (arrowheads) was evident in wild-type larvae, representing either hypodermal cells, iridophores or both, but transcript was not apparent in bnc2 mutant sections stained for equivalent times. (J,J2) Along the dorsal trunk, csf1b transcripts (arrowheads) were evident in both wild-type and bnc2 mutants. Scale bars: in (B) 60 μm for (B); in (C) 100 μm for (C); in (D) 100 μm for (D); in (E) 80 μm for (E,E2,F,F2,G,G2,I,I2), in (H) 80 μm for (H,H2); in (J) 20 μm for (J,J2). |
| Genes: | |
|---|---|
| Fish: | |
| Anatomical Terms: | |
| Stage Range: | Days 7-13 to Adult |