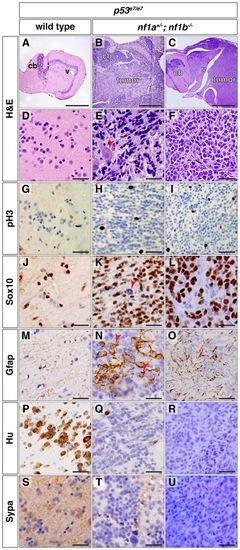
Tumors from nf1a+/-; nf1b-/-; p53e7/e7 animals express glial markers. (A–F) H&E staining of sagittal sections through p53e7/e7 brain tissue (A,D) or brain tumors in nf1a+/-; nf1b-/-; p53e7/e7 animals at 31 (B,E) and 33 (C,F) wpf (cb, cerebellum; v, ventricle). The arrowhead in E shows infiltration of a single cell through the parenchyma and around normal neurons. (G-U) Immunohistochemical analyses for phosphorylated histone H3 (G-I, pH3), SRY-box 10 (J-L, Sox10), glial fibrillary acidic protein (M-O, Gfap), HuC/D (P-R, Hu) and synaptophysin (S-U, Sypa) on sagittal sections through p53e7/e7 brain tissue (G,J,M,P,S) or brain tumors in nf1a+/-; nf1b-/-; p53e7/e7 animals at 31 (H,K,N,Q,T) and 33 (I,L,O,R,U) wpf demonstrate occasional mitoses in tumor tissue (H,I) with most tumor cells staining positive for the oligodendroglial marker Sox10 (K,L), a Sox10-negative subpopulation (K, arrowhead), an astrocytic component (N, arrowheads and O) and the absence of mature neuronal markers HuC/D (Q,R) or synaptophysin (T,U). Scale bars: 450 μm (A-C) and 20 μm (D-U).
|
