
Fig. 3
- ID
- ZDB-FIG-121031-35
- Publication
- Shimizu et al., 2012 - Visualization and exploration of Tcf/Lef function using a highly responsive Wnt/beta-catenin signaling-reporter transgenic zebrafish
- Other Figures
- All Figure Page
- Back to All Figure Page
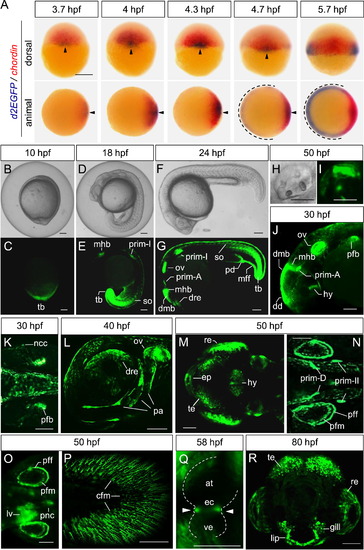
The Tcf/Lef-miniP:dGFP reporter was activated in a range of zebrafish embryo and larval tissues. (A) Whole-mount in situ hybridization of d2EGFP (red) and chordin (blue) at the indicated stage in Tcf/Lef-miniP:dGFP transgenic zebrafish embryos. The upper panels show dorsal views of embryos, with the animal side to the top. The lower panels show animal-side views of embryos, with the dorsal side to the right. The d2EGFP mRNA-expressing dorsal and ventrolateral regions are indicated with arrowheads and broken lines, respectively. Scale bar, 200 μm. (B–R) Expression of d2EGFP proteins in Tcf/Lef-miniP:dGFP transgenic zebrafish embryos and larvae. d2EGFP-expressing cells were visualized by fluorescence microscopy (C, E, G, I–R). (B, D, F, H) show bright-field (BF) images. Scale bar, 200 100 μm. (C–H) Left-side views of 10- (B, C), 18- (D, E), and 24-hpf (F, G) embryos. tail bud (tb), midbrain–hindbrain boundary (mhb), newly formed somites (so), dorsal retina (dre), dorsal midbrain (dmb), otic vesicle (ov), pronephric duct (pd), and median fin fold (mff). (H, I) Otic vesicle of 50-hpf embryos, with the anterior to the left and dorsal to the top. (J, K) Left-side head (J) and dorsal trunk (K) views of 30-hpf embryos. dorsal diencephalon (dd), hypothalamus (hy), pectoral fin bud (pfb), and neural crest cells (ncc). (L) Lower left-side head view of 40-hpf embryos. Developing pharyngeal arch (pa). (M–P) Dorsal head (M), dorsal trunk (N, O), and left-side tail (P) views of 50-hpf embryos were observed by macro confocal microscopy (M, N, P) or using a fluorescence stereomicroscope (O). Tectum (te), retina (re), epiphysis (ep), pectoral fin fold (pff) and mesenchymal cells (pfm), liver (lv), pancreas (pnc), and caudal fin mesenchymal cells (cfm). (Q) Heart of 58-hpf embryos. The endocardial cushion (ec) is indicated with white arrowheads. Atrium (at), ventricle (ve). (R) Front facial view of an 80-hpf embryo, with the dorsal side to the top. |
Reprinted from Developmental Biology, 370(1), Shimizu, N., Kawakami, K., and Ishitani, T., Visualization and exploration of Tcf/Lef function using a highly responsive Wnt/beta-catenin signaling-reporter transgenic zebrafish, 71-85, Copyright (2012) with permission from Elsevier. Full text @ Dev. Biol.