
FIGURE
Fig. 4
Fig. 4
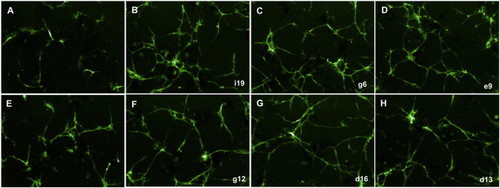
Representative Images of Candidate Compounds that Promoted Endothelial Proliferation and Tube Formation at Day 5 (A) Control. (B–D) Candidate compounds. i19, g6, e9, g12, d16, and d13, original plate well ID. (E) 2 μM SB 431542. (F–H) Candidate compounds. i19, g6, e9, g12, d16, and d13, original plate well ID. See also Figures S4 and S5. |
Expression Data
Expression Detail
Antibody Labeling
Phenotype Data
Phenotype Detail
Acknowledgments
This image is the copyrighted work of the attributed author or publisher, and
ZFIN has permission only to display this image to its users.
Additional permissions should be obtained from the applicable author or publisher of the image.
Full text @ Cell Rep.