
Fig. 6
- ID
- ZDB-FIG-120914-25
- Publication
- Keow et al., 2012 - Activity-based labeling of matrix metalloproteinases in living vertebrate embryos
- Other Figures
- All Figure Page
- Back to All Figure Page
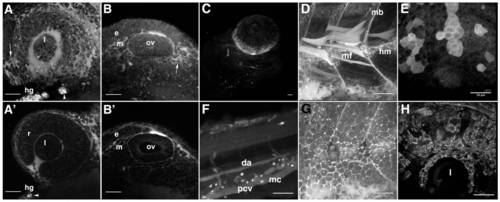
Details of HxBP labeling patterns reveal dynamics of active matrix remodeling. Z-projections of high magnification confocal micrographs illustrating patterns of HxBP labeling in both 24 hpf (A, B) and 72 hpf (C–H) zebrafish embryos. A) The developing zebrafish eye at 24 hpf, with HxBP labeling migratory mesenchyme (arrowhead), retinal epithelium (r), the choroid fissure and the hatching gland (hg). The lens shows no HxBP labeling, suggesting that matrix remodeling is absent in the lens. B) HxBP labeling the epithelial (e) and mesenchymal tissue (m) around the otic vesicle (ov), but no labeling within the otic vesicle. Primes are single focal planes of confocal stacks used to generate the non-prime panels. C) A ventrolateral view of the head of a 72 hpf embryo showing strong labeling in the developing scleral ossicles. Strong labeling is also evident in individual migratory mesenchyme cells and developing vasculature. D) lateral view of the anterior trunk showing strong labeling in the maturing myotome boundaries (mb), horizontal myoseptum (hm) and in individual myofibrils (mf) situated in the proliferative zone. E) Epithelia of the lateral head and dorsal aspect of the eye showing strong labeling in individual cells and patches of contiguous epithelial cells. F) lateral view of the tail showing strong labeling in migratory mesenchyme cells (mc), as well as labeling in the dorsal aorta (da), posterior cardinal vein (pcv) and intersomitic vessels (isv). G) lateral view of the surface epithelia covering the anterior trunk illustrating the ‘chicken wire’ patterning of HxBP labeling surrounding the periphery of the cells in this tissue. H) A dorsolateral view of the eye, illustrating strong HxBP labeling of mesenchymal cells invading across the surface of the retina and surrounding the lens (l). Scale bars are 50 μm in all panels. |