
Fig. 6
- ID
- ZDB-FIG-120914-17
- Publication
- Watkins et al., 2012 - High resolution imaging of vascular function in zebrafish
- Other Figures
- All Figure Page
- Back to All Figure Page
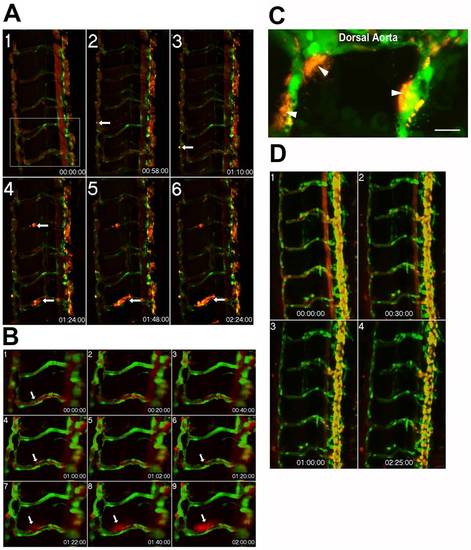
Time-lapse imaging of endothelial barrier dysfunction in response to the serine protease, thrombin. Extended depth of focus projection of the trunk vessels from a 5 dpf Tg(kdrl:GFP)la116 zebrafish larva (A). The EGFP-labeled endothelium appears green while the 0.1 μm FluoSpheres are pseudocolored red. Data were collected at baseline and at 10 minute intervals following exposure to thrombin (0.01 units/μL) for a total collection period of 3 hours. Localized increases in permeability, as evidenced by accumulation of microspheres outside the vessel wall (white arrows) were apparent by 1 h (panel 2) and increased over time (panels 3–6). The zoomed images (B) from boxed region of panel A1 show a clear break in the endothelial layer at 1 hour (panel 4). A total of 8 larvae were examined with equivalent results. These data were confirmed in a subset of larvae (n = 3) using high magnification (60X, 1.4 NA) point scanning confocal imaging and showed extensive accumulation of Fluospheres outside the vessel wall (C). In contrast, 5 dpf zebrafish larvae (n = 8) exposed to the thromboxane mimetic, U-46619 showed no evidence for disrupted barrier function (D). |