
FIGURE
Fig. 2
- ID
- ZDB-FIG-120914-14
- Publication
- Watkins et al., 2012 - High resolution imaging of vascular function in zebrafish
- Other Figures
- All Figure Page
- Back to All Figure Page
Fig. 2
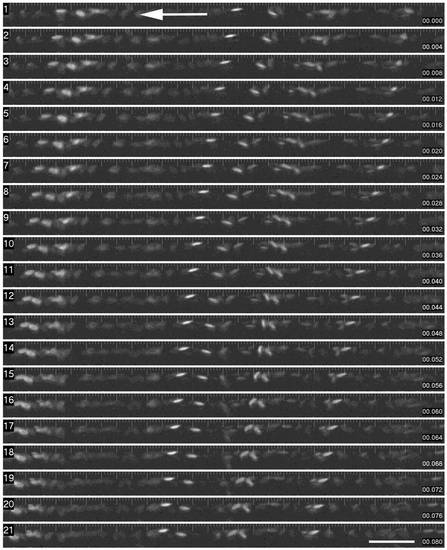
Time sequence of red blood cell flow through a segment of dorsal aorta. This montage shows individual images from a time sequence (collected every 2 ms, with a 2 ms exposure). The images shown are semi-sequential (4 ms intervals). Erythrocytes are readily visible, and the tracking of the cells from right to left can be readily seen. (Scale Bar = 100 microns). |
Expression Data
Expression Detail
Antibody Labeling
Phenotype Data
Phenotype Detail
Acknowledgments
This image is the copyrighted work of the attributed author or publisher, and
ZFIN has permission only to display this image to its users.
Additional permissions should be obtained from the applicable author or publisher of the image.
Full text @ PLoS One