
Fig. 6
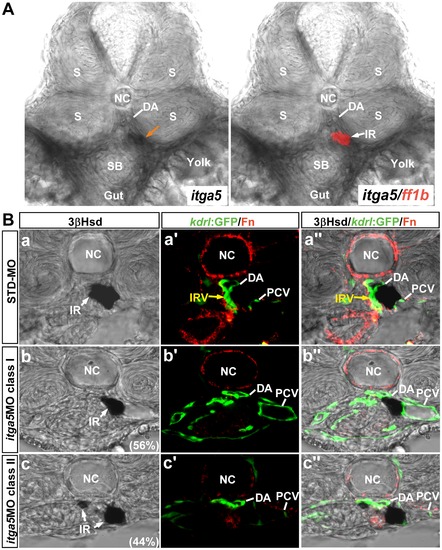
The expression and phenotype of itga5 at the level of interrenal tissue at 2 dpf. (A) The double ISH assay revealed that itga5 was expressed in the interrenal area and at the non-somitic mesodermal cells around the DA, the swim bladder (SB) and the gut. (B) The effect of itga5 knockdown on the interrenal tissue (IR, white arrows) and the peri-interrenal vasculature. Transverse sections of Tg(kdrl:GFP)s843 embryos injected with either STD-MO (a-a′′) or itga5 MOs (b-b′′, c-c′′) and assayed for 3β-Hsd activity (black), GFP (green) and Fn expression (red). All sections are oriented with the posterior end toward top of page. The accumulation of peri-vascular Fn and the formation of IRV (yellow arrows) are both disrupted upon the knockdown of itga5 expression. Abbreviations: notochord (NC), somite (S), dorsal aorta (DA), swim bladder (SB), interrenal tissue (IR), interrenal vessel (IRV), posterior cardinal vein (PCV). |
| Genes: | |
|---|---|
| Fish: | |
| Knockdown Reagents: | |
| Anatomical Terms: | |
| Stage: | Long-pec |
| Fish: | |
|---|---|
| Knockdown Reagents: | |
| Observed In: | |
| Stage: | Long-pec |