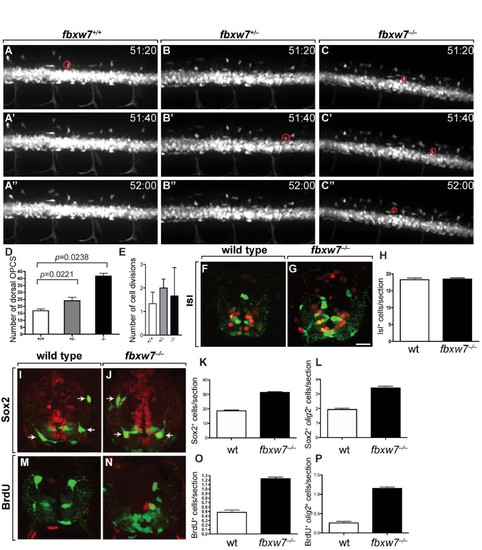
Excess OPCs arise from ventral spinal cord precursors in fbxw7vu56 mutant larvae. (A-C′′) Images of spinal cords, from lateral orientation, captured from time-lapse movies of fbxw7+/+ (A-A′′), fbxw7+/- (B-B′′) and fbxw7-/- (C-C′′) larvae carrying the Tg(olig2:EGFP) transgene to mark migrating OPCs. Dorsal is up in all images. Numbers in each panel indicate time (hours, minutes) post fertilization. Red circles mark newly formed OPCs initiating migration from ventral spinal cord. (D) Quantification of OPCs that migrated dorsally in fbxw7+/+ (n = 6), fbxw7+/- (n = 8) and fbxw7-/- (n = 3) larvae from 48 to 63 hpf. (E) Average number of OPC divisions in each genotype. (F,G) Transverse sections of 3 dpf spinal cords labeled with anti-Isl antibody to mark motor neurons (red) in combination with olig2:EGFP expression (green). (H) Quantification of Isl+ cells per section in wild-type sibling and fbxw7-/- larvae (n = 19 wild-type and 17 mutant larvae; p = 0.7658). (I,J) Transverse sections of 3 dpf spinal cords labeled with anti-Sox2 antibody to mark neural precursors (red) in combination with olig2:EGFP expression (green). Oligodendrocyte lineage cells also expressed Sox2 (arrows). Quantification of total spinal cord Sox2+ (K) and Sox2+olig2:EGFP+ (L) cells in wild-type and mutant larvae (n = 17 wild-type and 16 mutant larvae; p<0.0001). (M,N) Transverse sections of 3 dpf spinal cords labeled to detect BrdU incorporation (red) in combination with olig2:EGFP expression (green). Quantification of total spinal cord BrdU+ (O) and BrdU+olig2:EGFP+ (P) cells per section in wild-type sibling and fbxw7-/- larvae (n = 18 wild-type and 15 mutant larvae; p<0.0001). Error bars represent SEM.
|
