
FIGURE
Fig. S1
Fig. S1
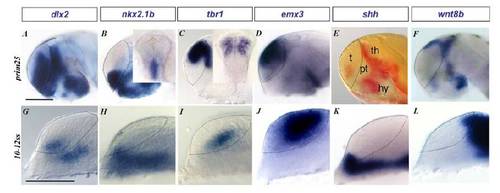
Pallial and Subpallial Domains Are Detectable from Mid-Somite Stage in Zebrafish |
Expression Data
Expression Detail
Antibody Labeling
Phenotype Data
Phenotype Detail
Acknowledgments
This image is the copyrighted work of the attributed author or publisher, and
ZFIN has permission only to display this image to its users.
Additional permissions should be obtained from the applicable author or publisher of the image.
Reprinted from Developmental Cell, 16(4), Danesin, C., Peres, J.N., Johansson, M., Snowden, V., Cording, A., Papalopulu, N., and Houart, C., Integration of telencephalic Wnt and hedgehog signaling center activities by Foxg1, 576-587, Copyright (2009) with permission from Elsevier. Full text @ Dev. Cell