
Fig. 7
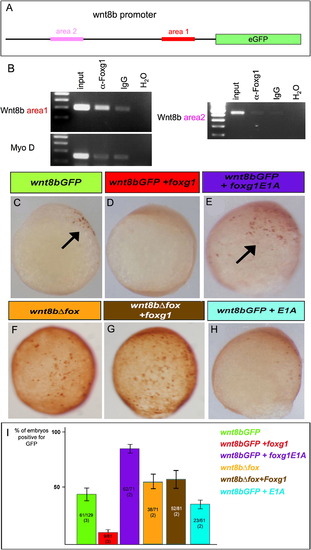
Foxg1 Binds to the wnt8b Promoter and Represses Its Transcription(A) Schematic of the wnt8b promoter sequence cloned and used for the transgenic construct (see Figure S6).(B) PCR results of the ChIP assay. The Foxg1 ChIP shows a specific enrichment of the area 1 band of the wnt8b promoter (see Figure S6) compared to MyoD (negative control) or area 2 and significantly higher enrichment than in the IgG ChIP (background control).(C–H) Lateral views (anterior is oriented toward the top of the bud-stage embryos) showing cells expressing GFP (brown), under the control of the wnt8b promoter described in (A) and in Figure S6. (C–E and H) Wnt8b1.4:GFP DNA or (F and G) wnt8b1.4ΔFox:GFP injected either (C and F) alone or with (D and G) Foxg1, (E) FoxG1-E1A, or (H) E1A transcripts.(I) Quantification of embryos showing GFP expression. The numbers shown are the sum of two independent experiments with standard deviation. |
Reprinted from Developmental Cell, 16(4), Danesin, C., Peres, J.N., Johansson, M., Snowden, V., Cording, A., Papalopulu, N., and Houart, C., Integration of telencephalic Wnt and hedgehog signaling center activities by Foxg1, 576-587, Copyright (2009) with permission from Elsevier. Full text @ Dev. Cell