
Fig. 6
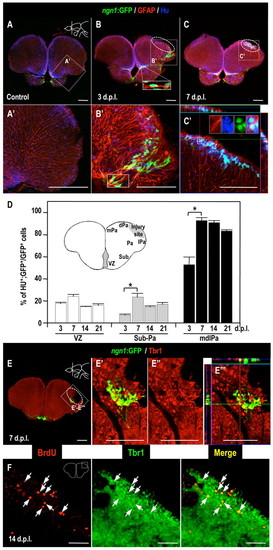
Neuronal precursor cells differentiate into neurons adjacent to the injury site. (A–C) Immunodetection of Hu (blue), GFAP (red) and GFP (green) in coronal brain sections of the lesioned adult Tg(ngn1:gfp) fish brain (dorsal up): (A) control; (B) 3 dpl; (C) 7 dpl. Higher magnifications of the boxed areas in panels A–C are shown in A′–C′, respectively. Insets in B, B′ and C′ show high-magnification views of the boxed areas in B, B2, and C′, respectively. (D) The total count of GFP-positive cells, and the percentage that was also positive for Hu, in the telencephalic VZ, subpallium (Sub) and pallium (Pa), and the medial-dorsal-lateral domain of the telencephalic pallium (mdlPa). Student’s t-test was used to determine significant differences in expression. Error bars represent s.e.m. *P<0.05. (E) Immunodetection of Tbr1 (red) and GFP (green) in coronal brain sections (dorsal up) of injured adult Tg(ngn1:gfp) zebrafish at 7 dpl. Higher magnifications of the boxed areas in panel E are shown in panels E′–E′′ ′. The ngn1:gfp-positive cells expressed Tbr1 protein. (F) Immunodetection of BrdU (red) and Tbr1 (green) in coronal brain sections (dorsal up) of the injured adult wild-type fish at 14 dpl. White arrows indicate BrdU and Tbr1 double-positive cells. BrdU-labeling protocol: see Fig. 4A. White dotted circles indicate the injury site. Scale bars: 100 μm (A–C,E); 50 μm (F). |