
Fig. S4
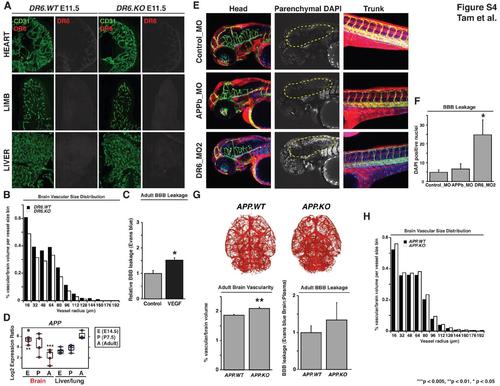
DR6-Ligand APP is Not Required for Proper CNS Barriergenesis and Additional DR6 Knockout Data, Related to Figure 4 (A) DR6 protein expression is absent in CD31-positive peripheral vasculature. Immunohistochemical staining for DR6 protein failed to detect signal in heart, limb, and liver vasculature from E11.5 embryos (left panels). Low background signal is not DR6 protein, as no difference in antibody signal was apparent in DR6.KO embryos (right panels). Results representative of at least three independent experiments are shown. The following abbreviations are used: WT, wild-type; KO, knockout. (B) Vessel size distribution of microCT CNS vascular network indicates that DR6 is required for proper CNS vascular density across all vessel sizes. Vascular density was calculated as a function of vascular volume normalized by brain volume per vessel size bin. No differences were observed between the relative size distributions of the two groups indicating that the reduction in vascular density is uniformally distributed and that DR6 is required for the proper development of a wide range of CNS vessels. n = 6 (DR6.WT), n = 6 (DR6.KO). (C) As previously described, direct intracortical injection of VEGF induces Evans blue leakage across the BBB (Eliceiri et al., 1999). n = 4 (control), n = 4 (VEGF). Data are presented as the mean ± SEM (*p < 0.05). (D) Expression profiling FACS-purified BBB and liver/lung vasculature show enrichment of APP during embryogenesis. Box and whisker plots indicate distribution of data and highlight median (horizontal line through box) and the 25th and 75th quartiles (box edges). Expression values were compared between brain and liver/lung tissue at a single developmental stage and statistical significance was defined as those comparisons yielding an adjusted p-value (***p < 0.005; **p < 0.01). Further details of statistical analysis are described in experimental procedures. (E) Morpholino-mediated APPb knockdown leads to CNS angiogenic defects, but barrier function remains intact. Upon 4 ng control, APPb, or DR6 morpholino injection, both APPb and DR6 knockdown embryos exhibit CNS vascular network defects. Unlike DR6 knockdown however, APPb morphant exclusion of BBB leakage tracer DAPI is indistinguishable from control morpholino-injected embryos. As described in experimental procedures, DAPI-positive brain parenchymal nuclei were visually isolated by computationally removing brain vasculature-derived DAPI signal from the DAPI channel. Endothelial cells are green, DAPI is blue, rhodamine-dextran is red. Results representative of at least three independent experiments are shown. (F) Quantification of DAPI leakage across the zebrafish BBB upon APPb or DR6 knockdown. Significant increase in labeling of brain parenchmyal nuclei is detected upon DR6 knockdown, but not APPb knockdown. n = 7 (control_MO), n = 7 (APPb_MO), n = 7 (DR6_MO2). Data are presented as the mean ± SEM (*p < 0.05). (G) APP knockout adult mice exhibit increased vascular density but not barrier function defects. Vascular projections of APP.WT and APP.KO brains were carried out as in Figure 4C to illustrate the widespread increase in vascular density upon APP deletion. Results representative of at least three independent experiments are shown (top panel). Vascular density was quantified as a function of vascular volume normalized by brain volume. n = 13 (APP.WT), n = 12 (APP.KO). Data are presented as the mean ± standard error of the mean (SEM) (**p < 0.01) (bottom left panel). Evans blue leakage assay detects fully function barrier in adult APP.KO mice. n = 8 (APP.WT), n = 4 (APP.KO) (bottom right panel). (H) Vessel size distribution of microCT CNS vascular network indicates that APP is required for proper CNS vascular density across all vessel sizes. Vascular density was calculated as a function of vascular volume normalized by brain volume per vessel size bin. No differences were observed between the relative size distributions of the two groups indicating that the increase in vascular density is uniformally distributed and that APP is required for the proper development of a wide range of CNS vessels. n = 13 (APP.WT), n = 12 (APP.KO). |
| Gene: | |
|---|---|
| Fish: | |
| Knockdown Reagents: | |
| Anatomical Terms: | |
| Stage: | Protruding-mouth |
| Fish: | |
|---|---|
| Knockdown Reagents: | |
| Observed In: | |
| Stage: | Protruding-mouth |
Reprinted from Developmental Cell, 22(2), Tam, S.J., Richmond, D.L., Kaminker, J.S., Modrusan, Z., Martin-McNulty, B., Cao, T.C., Weimer, R.M., Carano, R.A., van Bruggen, N., and Watts, R.J., Death Receptors DR6 and TROY Regulate Brain Vascular Development, 403-417, Copyright (2012) with permission from Elsevier. Full text @ Dev. Cell