
Fig. S3
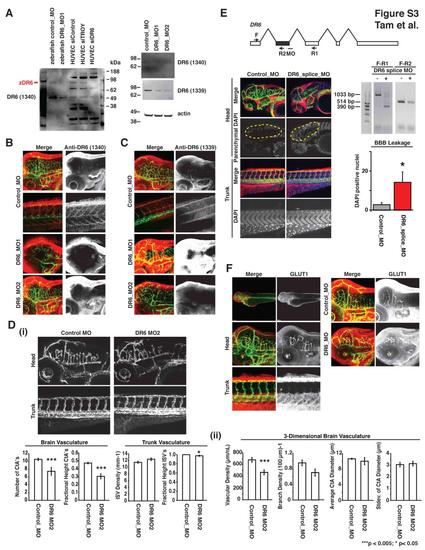
DR6 Zebrafish Expression, Knockdown Confirmation, Additional Morpholino Data, and GLUT1 Localization, Related to Figure 3 (A) Immunoblot verification of DR6 protein expression and knockdown in zebrafish. siRNA targeting DR6 in human umbilical vein endothelial cells (HUVEC) leads to the disappearance of an approximately 90 kDa band from lysates detected by anti-DR6 antibody 1340. Similarly, morpholino-mediated knockdown of zebrafish DR6, using two non-overlapping translation-blocking morpholinos DR6_MO1 and DR6_MO2, also lowers signal of the same 90 kDa band detected by anti-DR6 antibodies 1340 and 1339. Results representative of at least three independent experiments are shown. (B-C) DR6 is expressed in Tg(kdrl:egfp) zebrafish CNS vasculature but not trunk intersegmental vessels. Consistent with mouse expression profiling data, whole mount staining of 3 dpf embryos with anti-DR6 antibodies 1339 and 1340 detects DR6 protein (red) in CNS vasculature (green) but not in the peripheral vasculature. This localization is eliminated upon knockdown mediated by two non-overlapping translation-blocking morpholinos. Images were acquired by confocal microscopy and z-projections are shown. (D) Similar to observations using DR6_MO (aka DR6_MO1) from Figure 3, non-overlapping translation blocking morpholino targeting DR6 (DR6_MO2) has CNS-specific vascular defects in the developing Tg(kdrl:egfp) zebrafish embryo. (i) 2D quantification of 3 dpf zebrafish vasculature utilized n = 36 (control_MO), n = 7 (DR6_MO2). (ii) 3D quantification of 3 dpf zebrafish hindbrain vasculature utilized n = 4 (control_MO), n = 6 (DR6_MO2). Data are presented as the mean ± SEM (***p < 0.005; *p < 0.05). (E) Splice-blocking morpholino targeting DR6 (dr6_splice_MO) deletes targetedexon (shown in grey) and phenocopy translation-blocking morpholinos. 8 ng DR6 splice-blocking morpholino injected 3 dpf embryos lead to CNS-specific vascular and barriergenesis defects. As described in experimental procedures, DAPI-positive brain parenchymal nuclei were visually isolated by computationally removing brain vasculature-derived DAPI signal from the DAPI channel. Two primer sets were used to verify splice-blocking by RT-PCR analysis. n = 8 (control_MO), n = 8 (DR6_splice_MO). Data are presented as the mean ± SEM (*p < 0.05). (F) GLUT1 is enriched at the zebrafish BBB and is not affected by DR6 knockdown. 3 dpf zebrafish embryos injected with control or DR6-targeting morpholinos were analyzed. Whereas GLUT1 signal cannot be found in trunk vasculature, CNS vessels show strong GLUT1 expression. This expression pattern is not changed upon DR6 knockdown. Images were acquired by confocal microscopy and z-projections are shown. |
| Genes: | |
|---|---|
| Antibodies: | |
| Fish: | |
| Knockdown Reagent: | |
| Anatomical Terms: | |
| Stage: | Protruding-mouth |
Reprinted from Developmental Cell, 22(2), Tam, S.J., Richmond, D.L., Kaminker, J.S., Modrusan, Z., Martin-McNulty, B., Cao, T.C., Weimer, R.M., Carano, R.A., van Bruggen, N., and Watts, R.J., Death Receptors DR6 and TROY Regulate Brain Vascular Development, 403-417, Copyright (2012) with permission from Elsevier. Full text @ Dev. Cell