
Fig. 3
- ID
- ZDB-FIG-120216-39
- Publication
- Asakawa et al., 2012 - An mnr2b/hlxb9lb enhancer trap line that labels spinal and abducens motor neurons in zebrafish
- Other Figures
- All Figure Page
- Back to All Figure Page
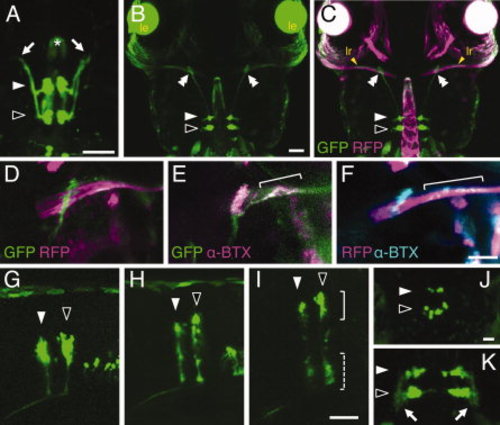
Green fluorescent protein (GFP) expression in the hindbrain in the HGj4A larvae. A: Dorsal view of the hindbrain in the HGj4A embryo at 48 hours postfertilization (hpf). The arrows indicate the tip of the axon-like processes. The asterisk indicates the GFP signal in the notochord. The anterior is to the top. B,C: Dorsal view of the head region of the HGj4A;hspGFFDMC131B;UAS:RFP larvae at 72 hpf. The GFP signal (green) in B was merged into the red fluorescent protein (RFP) signal (magenta) in C. The bilateral saturated spheres are lens (le, in B). The green striations below the lens are autofluorescence generated from the pigment cells. In C, the yellow arrows indicate the lateral rectus muscles (lr). The double arrowheads indicate the position where the contact between the axons of the abducens motor neuron and the lateral rectus muscle is evident. The anterior is to the top. D–F: The dorsal view of the right lateral rectus muscles innervated by the abducens motor neurons at 120 hpf. D: An HGj4A;hspGFFDMC131B;UAS:RFP larva. E: An HGj4A larva stained with anti-GFP antibody (green) and α-Bungarotoxin (magenta). F: An hspGFFDMC131B larva stained with anti-RFP antibody (magenta) and α-Bungarotoxin (cyan). The brackets in E and F indicate the punctate AChRs. The anterior is to the top. G–I: The lateral view of the hindbrain at 48 hpf (G), 72 hpf (H), and 120 hpf (I). The brackets and dashed brackets indicate the dorsal and ventral GFP-positive clusters, respectively. J,K: Dorsal views of the hindbrain. The z-stacks of the dorsal (the bracket in I) and ventral (the dashed bracket in I) clusters are shown in J and K, respectively. The arrows indicate the dendritic structure. The anterior is to the top. In all panels, the filled and open arrows indicate the positions of the GFP-positive clusters, which correspond to r5 and r6, respectively. Scale bars = 50 μm in A–F, 20 μm in J,K |