
Fig. 1
- ID
- ZDB-FIG-120216-37
- Publication
- Asakawa et al., 2012 - An mnr2b/hlxb9lb enhancer trap line that labels spinal and abducens motor neurons in zebrafish
- Other Figures
- All Figure Page
- Back to All Figure Page
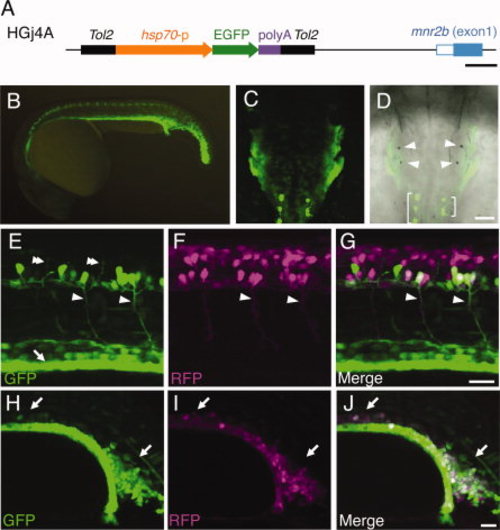
Green fluorescent protein (GFP) expression directed by the HGj4A insertion. A: Structure of the HGj4A insertion. The enhancer trap construct T2KHG (Nagayoshi et al., 2008) is composed of the Tol2 sequences (black), the zebrafish hsp70 promoter (orange), the GFP gene (green) and the SV40 polyA signal (purple). The 52 untranslated region and the first coding exon of the mnr2b gene are shown as the open and filled blue boxes, respectively. B: The lateral view of the HGj4A embryo at 22 hours postfertilization (hpf). C,D: The dorsal view of the HGj4A embryo at the hindbrain level at 22 hpf. The anterior is to the top. The GFP signal in C was merged into the bright field image in D. The arrowheads indicate the position of the otoliths. The brackets indicate the GFP-positive neuronal cells in the central nervous system. E–G: The lateral view of the trunk in the HGj4A;SAIGFF213A;UAS:RFP triple transgenic embryo at 22 hpf. The arrowheads indicate the CaP axons. The double arrowheads indicate the MiP axons. The arrow indicates the GFP expression in endodermal cells. H–J: The lateral view of the trunk in the HGj4A;Tg(gata1-RFP) double transgenic embryo at 22 hpf. The arrows indicate the intermediate cell mass, where the GFP and red fluorescent protein (RFP) signals are extensively overlapped. UAS, upstream activating sequence. Scale bars = 500 bp in A, 50 μm in C,D, 30 μm in E–J. |