
Fig. 5
- ID
- ZDB-FIG-120209-6
- Publication
- Liu et al., 2012 - pitx2 Deficiency Results in Abnormal Ocular and Craniofacial Development in Zebrafish
- Other Figures
- All Figure Page
- Back to All Figure Page
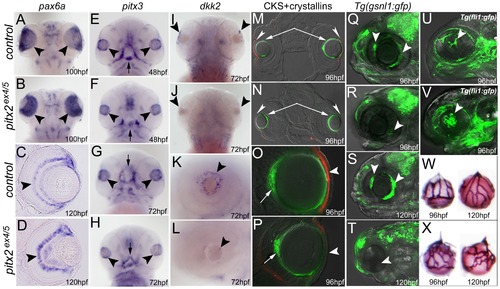
Ocular development and marker expression in pitx2ex4/5 morphants. In situ hybridization (A–L), double immunohistochemistry (M–P), live gfp fluorescence images (Q–V) and alkaline phosphatase staining (W, X) for control and morphant embryos are shown and are labeled with corresponding developmental stages in the lower right corner; dorsal (A, B, I, J) and ventral (E–H) views of a zebrafish larval head as well as transverse sections at the eye level (C, D, M–P), all positioned anterior to the top, and lateral views of an embryonic eye (K, L) or head (Q–V), positioned anterior to the left, are shown. Please note expression of pax6a in the developing retina of the control and morphant embryos (arrowheads in A–D); similar pitx3 expression in the developing lens in 48–72-hpf control and morphant embryos (arrowheads in E–H; abnormally developing pharyngeal arches and oral cavity in 48–72-hpf embryos are marked with arrows); reduced expression of dkk2 in the anterior segment of the pitx2 morphants (arrowheads in I–L); decreased/absent expression of corneal keratan sulfate proteoglycan (CKS) in the developing morphant corneas (red fluorescence, arrowheads in M–P) but similar expression of crystallins αA (green fluorescence, arrows in M, N) and βB1 (green fluorescence, arrows in O, P) in control and morphant lenses; and a decreased/absent expression of the Tg(gsnl1:gfp) transgene in the developing iridocorneal structures of pitx2ex4/5 morphants (arrowheads in R, T) in comparison to control embryos (Q, S). In addition to this, fluorescence (Tg(fli1:gfp) transgene) images (U, V) as well as alkaline phosphatase staining (W, X) demonstrate abnormal development of the hyaloid vasculature in pitx2ex4/5 morphants (arrowhead in V) in comparison to control embryos (U); increased number and disorganized appearance of pitx2ex4/5 hyaloid vessels (X) in comparison to controls (W) is revealed by alkaline phosphatase staining. |
| Genes: | |
|---|---|
| Fish: | |
| Knockdown Reagent: | |
| Anatomical Terms: | |
| Stage Range: | Long-pec to Day 5 |
| Fish: | |
|---|---|
| Knockdown Reagent: | |
| Observed In: | |
| Stage Range: | Long-pec to Day 5 |