
Fig. 6
- ID
- ZDB-FIG-110624-36
- Publication
- Rothenaigner et al., 2011 - Clonal analysis by distinct viral vectors identifies bona fide neural stem cells in the adult zebrafish telencephalon and characterizes their division properties and fate
- Other Figures
- All Figure Page
- Back to All Figure Page
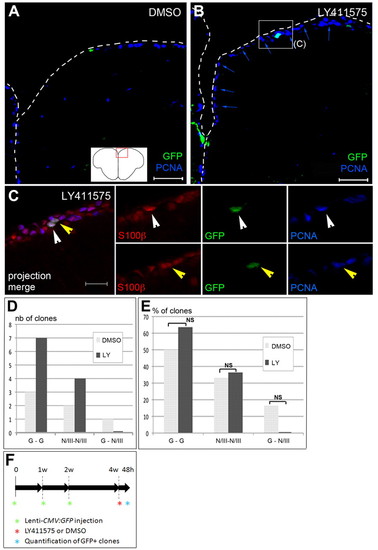
Notch activity modulates proliferation rate within the glia and neuroblast populations. (A,B) Effect of Notch blockade on cell proliferation at the VZ 14-28 days after lentiviral injection (see F), visualized on cross-sections double-stained for GFP (green) and PCNA (blue) (ventricle delimited by the dotted line). Scale bars: 50 μm. (C) Example of a symmetric gliogenic division occurring upon Notch blockade. The section is triple-stained for S100β (red), GFP (green) and PCNA (blue). The left panel is the merged image of the boxed area in B (confocal projection of a 7 μm stack) and right panels are single channel views of optical sections taken at different z planes to visualize the two daughter cells (white and yellow arrowheads). Both cells are PCNA positive. Scale bar: 20 μm. (D,E) Number of clones (D) and proportion of clones (E) of each division type (G-G, symmetric gliogenic; III-III, symmetric neurogenic; G-N/III, asymmetric) in control (DMSO) or LY411575 (LY)-treated brains 14-28 days after lentiviral injection. In E, P>0.3 in a Fisher′s exact test. Number of PCNA-positive glial cells generated from G-G divisions: two in DMSO-treated and four in LY-treated brains. (F) Scheme of the Notch blockade experiment. |