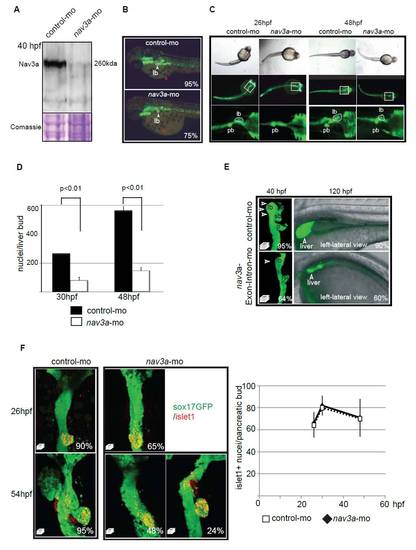
Nav3a morpholino-mediated knockdown affects liver budding without causing growth retardation. (A) Morpholino antisense RNA, targeting the nav3a-ATG region, injected in sox17:GFPs870 one-cell-stage embryos resulted in a robust inhibition of Nav3 protein expression in vivo, as analyzed by Western blot. (B) Nav3a morpholino injections resulted in defective liver budding (liver bud, lb, indicated by the white arrowhead and dotted line) but did not influence pigmentation (red arrowheads). Sox17:GFPs870 embryos injected with control morpholino or nav3a morpholino were examined at 48 hpf for pigmentation as a marker for developmental retardation. The percentage of embryos exhibiting a similar appearance to that shown here is indicated in the lower right-hand corner (n=50 per group). (C) Nav3a-ATG morpholino injections result in defective liver, pancreatic and swim bladder-bud development. General body shape remains normal. Single cell stage sox17:GFPs870 embryos were injected with morpholino antisense RNA, targeting the nav3a ATG region and analyzed by fluorescence and light microscopy. Upper panel: Normal light microscopy pictures showing comparable body shape of control morpholino- and nav3a-ATG morpholino-injected embryos. Middle and lower panel: Predominantly liver-bud, pancreatic-bud and swim bladder-bud development were affected. Other sox17:GFP positive regions like gut and pharyngeal arches, between 26 and 48 hpf, did not differ between control and nav3a morphants. (D) Nav3a depletion resulted in a significantly reduced number of cells in the liver bud: Liver buds of sox17:GFPs870 embryos were imaged by confocal microscopy. Whole-mount DAPI staining of nav3a- and control-morpholino-injected embryos were performed. Confocal stacks spanning the whole liver bud were prepared and nuclei in the liver bud were counted. In each group n=5 embryos were analyzed. Mean ± s.e.m. is plotted. (E) Nav3a depletion by a nav3a splice blocking morpholino resulted in reduced liver budding and growth. Left panel: Dorsal view of liver bud formation at 40 hpf, imaged by confocal microscopy. Representative confocal stack pictures of gut-GFP embryos show reduced liver budding in nav3a morphant embryos (lower-left picture) compared with normal liver budding in control morpholino-injected embryos (upper-left picture). 64% of the analyzed nav3a morphant embryos developed smaller liver buds. In each group n=150 embryos were analyzed. Right panels: Lateral view of liver size at 120 hpf, imaged by confocal microscopy. Representative confocal stack pictures of gut-GFP embryos showed reduced liver growth in nav3a morphant embryos (lower right panel) compared with normal liver organogenesis in control morpholino-injected embryos (upper right panel). 60% of analyzed nav3a morphant embryos at 120 hpf had a smaller liver. In each group n=150 embryos were analyzed. lb, liver bud; sb, swim bladder primordium; p, pancreatic bud. (F) Loss of nav3a affects dorsal pancreatic budding without affecting specification. Sox17:gfp embryos were injected with control- or nav3a-morpholino and the expression domain of the pancreatic marker islet1 was assessed by immunofluorescence. At 26 hpf we observed no difference in the number of pancreatic islet1-positive cells between nav3a morphants and control morpholino-injected embryos (F, upper panels, quantification in right-hand panel). Despite islet1-positive cells being detectable at 30 hpf and 54 hpf, we observed reduced dorsal pancreatic budding in a subgroup (48%) of nav3a morphant embryos (lower-middle panel). In a smaller subset of embryos (24%) pancreatic budding was only slightly affected (lower-right panel). Quantification in right-hand panel: Islet1-positive cells in the dorsal pancreatic bud were counted within confocal stacks of indicated groups. We analyzed n=5 representative embryos per group at each time point. Mean ± s.e.m. are plotted. For all pictures, the percentage of embryos exhibiting a similar expression pattern is indicated in the lower right corner (n=100 embryos/group). E and F show dorsal view.
|
