
Fig. 4
- ID
- ZDB-FIG-110516-20
- Publication
- Klein et al., 2011 - Neuron navigator 3a regulates liver organogenesis during zebrafish embryogenesis
- Other Figures
- All Figure Page
- Back to All Figure Page
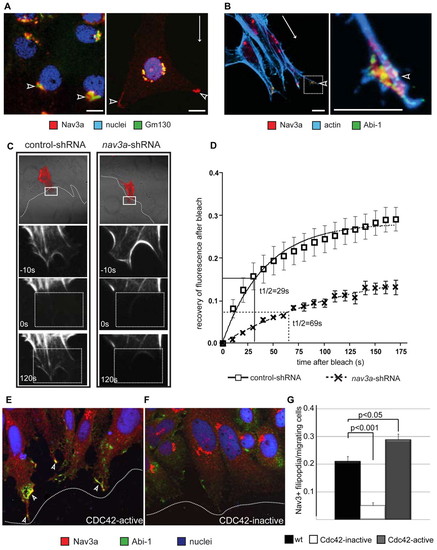
Nav3a regulates actin in cell protrusions of moving cells. (A,B) Nav3a, actin and Abi1 immunofluorescence staining in quiescent and migrating ZFL liver cells. White arrows indicate the direction of migration. In non-migrating cells Nav3a localizes in the Golgi apparatus and here it colocalizes with the Golgi matrix protein gm130 (A, left-hand panel, arrowheads). In migrating cells, Nav3a is localized in distal ends of cell protrusions (A, right-hand panel, white arrowhead). Nav3a, Abi-1 and actin co-localized in distal ends of filipodia and lamellipodia (B, left-hand panel, white arrowheads) of migrating cells. Right-hand panel in B is a higher magnification of the boxed area in the left-hand panel. (C,D) Nav3a regulates actin polymerization dynamics in cell protrusions of migrating cells. Pac-2 cells stably expressing control shRNA or Nav3a shRNA were analyzed for actin polymerization dynamics by the FRAP (fluorescence recovery after photobleaching) assay. Cells were transfected with a vector coding the actin binding protein lifeact-RFP and scratch assays were performed. Representative pictures of fluorescence recovery after photobleaching showed that in Nav3a-deficient cells fluorescence-labeled actin bundles recovered more slowly compared with control cells (C, left-hand panels control; right-hand panels Nav3a deficient). (D) The recovery kinetics of lifeact-RFP after photobleaching, together with the half-life (t1/2) data. n=15 per group, data are presented as mean ± s.e.m. The FRAP experiments were repeated three times. Boxed areas in top panel are shown at higher magnification below. Dotted boxed areas indicate area of photobleaching. (E-G) Cdc42 mediates Nav3a protein translocation to cellular protrusions during cell migration. (E) Pac-2 cells were transfected with a constitutively active form of Cdc42. Activation of Cdc42 resulted in Nav3a translocation to distal ends of filipodia. (F) Transfection of inactive Cdc42-N17 inhibited Nav3a translocation. Arrowheads indicate Abi1-Nav3a double-positive cells. Dotted lines indicate the migration front. (G) Quantification of filipodia formation. n=300 cells per group, data are presented as mean ± s.e.m. |