
FIGURE
Fig. 2
- ID
- ZDB-FIG-110322-69
- Publication
- Burroughs-Garcia et al., 2011 - Evolutionarily conserved function of Gbx2 in anterior hindbrain development
- Other Figures
- All Figure Page
- Back to All Figure Page
Fig. 2
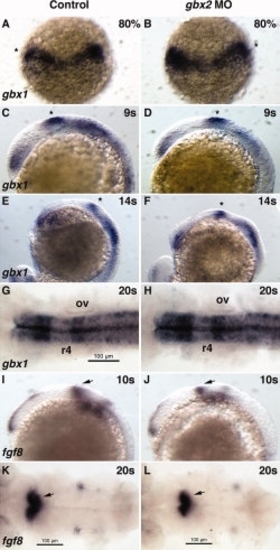
Expression of mid-hindbrain markers is not affected in gbx2 morphants. A–L: Comparative analysis of gbx1 expression in wild-type embryos (A,C,E,G) and embryos injected with 8 ng of gbx2-MO (B,D,F,H). A,B: Dorsal views with anterior to the top. C–F: Lateral views with anterior to the left. G,H: Dorsal views wth anterior to the left. I–L: Comparative analysis of fgf8 expression in wild-type (I,K) and gbx2 morphants (J,L). ov, otic vesicle; 80%, 80% epiboly; s, somite-stage; *, midbrain/hindbrain boundary. |
Expression Data
| Gene: | |
|---|---|
| Fish: | |
| Knockdown Reagent: | |
| Anatomical Terms: | |
| Stage Range: | 75%-epiboly to 20-25 somites |
Expression Detail
Antibody Labeling
Phenotype Data
Phenotype Detail
Acknowledgments
This image is the copyrighted work of the attributed author or publisher, and
ZFIN has permission only to display this image to its users.
Additional permissions should be obtained from the applicable author or publisher of the image.
Full text @ Dev. Dyn.