
Fig. 6
- ID
- ZDB-FIG-101213-11
- Publication
- Segalen et al., 2010 - The Fz-Dsh Planar Cell Polarity Pathway Induces Oriented Cell Division via Mud/NuMA in Drosophila and Zebrafish
- Other Figures
- All Figure Page
- Back to All Figure Page
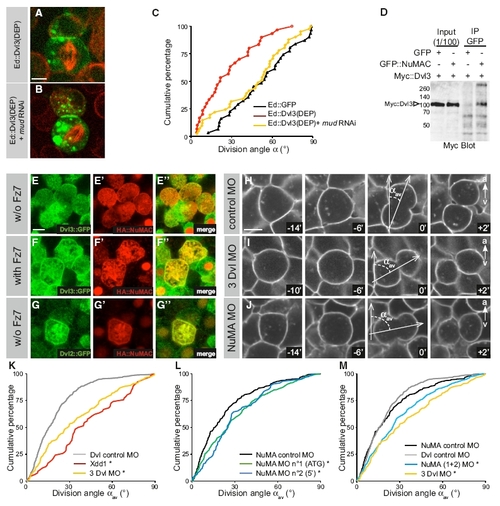
NuMA Controls Mitotic Spindle Orientation Downstream of the Fz PCP Pathway during Zebrafish Gastrulation (A and B) Dvl3(DEP), C-terminal region of Dvl3 containing the DEP domain was fused in frame to Echinoid tagged with GFP (green) and transfected into S2 cells. Cells were stained for α-tubulin (red). Ed::Dvl3(DEP) (A); Ed::Dvl3(DEP) + mud RNAi corresponds to Ed::GFP fused to Dvl3(DEP) and RNAi against mud (B). Scale bar in (A) represents 2 μm. (C) Cumulative plot of angles measured in the S2 cell "induced polarity" assays in Ed::GFP (black line), Ed::Dvl3(DEP) (red line), and Ed::Dsh(DEP) and mud RNAi (yellow line). (D) Anti-Myc antibody western blot of GFP::NuMAC immunoprecipitates from extracts of HEK293T cells expressing full-length Dvl3::Myc. Arrowhead indicates Dvl3::Myc. (E-G) Localization of Dvl and NuMAC in epiblast cells during gastrulation. Localization of Dvl3::GFP (green in E and E″) and HA::NuMAC (red in E′ and E″) in interphasic and dividing epiblast cells without Fz7 coinjection. Localization of Dvl3::GFP (green in F and F″) and HA::NuMAC (red in F′ and F″) in interphasic and dividing epiblast cells with Fz7 coinjection. Cortical enrichment of HA::NuMAC was observed in 7 of 14 epiblast cells in division in absence of Fz7, whereas most of the dividing epiblast cells (12 of 14) have a strong cortical localization and cytoplasmic depletion of HA::NuMAC when Dvl3::GFP was strongly enriched at the cortex on Fz7 coinjection. Localization of Dvl2::GFP (green in G and G″) and HA::NuMAC (red in G′ and G″) in a dividing epiblast cells in absence of Fz7 coinjection. Scale bar in (E) represents 10 μm. (H-J) Confocal time-lapse images of embryos labeled with membrane-GFP and injected with the control morpholino (H) or the triple Dvl MO (I) or the NuMA ATG morpholino (J). Observations are done on the dorsal side, from shield stage to 80% epiboly, and limited to the neuro-ectoderm. Scale bars in (H) represent 10 μm; animal pole is to the top. Time is in minutes. (K-M) Cumulative plot of αav in embryos injected with the Dvl control morpholino (n = 311 divisions in four embryos), or the Xdd1 construct (n = 66, in one embryo, already shown by Gong et al. [2004]) or the three Dvl morpholinos (n = 183, in four embryos) (K); Cumulative plot of αav in embryos injected with the NuMA control morpholino (n = 304 divisions in five embryos), the NuMA "ATG" morpholino (n = 339 divisions in nine embryos), the NuMA "5′ " morpholino (n = 118 divisions in three embryos) (L); Cumulative plot of αav in embryos injected with the NuMA control morpholino (n = 311 divisions in four embryos), the Dvl control morpholino (n = 183 divisions in four embryos), the NuMA "ATG" morpholino (n = 339 divisions in nine embryos) and the NuMA "5′ " morpholino (n = 118 divisions in three embryos) pooled together or triple Dvl morpholino (n = 183, in four embryos) (M). *p < 0.001 relative to control experiments. |
| Fish: | |
|---|---|
| Knockdown Reagents: | |
| Observed In: | |
| Stage Range: | Shield to 75%-epiboly |
Reprinted from Developmental Cell, 19(5), Segalen, M., Johnston, C.A., Martin, C.A., Dumortier, J.G., Prehoda, K.E., David, N.B., Doe, C.Q., and Bellaiche, Y., The Fz-Dsh Planar Cell Polarity Pathway Induces Oriented Cell Division via Mud/NuMA in Drosophila and Zebrafish, 740-752, Copyright (2010) with permission from Elsevier. Full text @ Dev. Cell