
Fig. 5
- ID
- ZDB-FIG-101208-33
- Publication
- Yasuda et al., 2010 - Transgenic zebrafish reveals novel mechanisms of translational control of cyclin B1 mRNA in oocytes
- Other Figures
- All Figure Page
- Back to All Figure Page
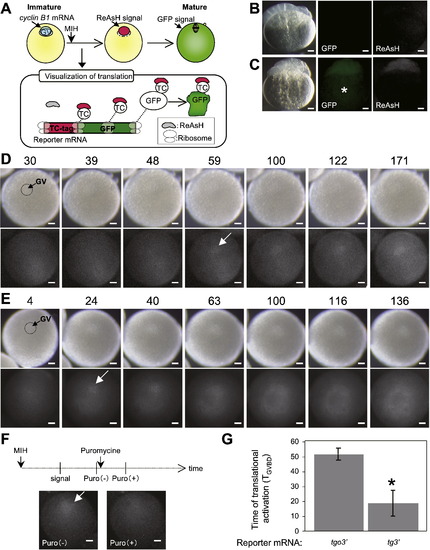
Real-time imaging of temporally controlled translation. (A) Schematic views for visualization of the translation site and timing during oocyte maturation. The cyclin B1 mRNA is localized to the animal pole of immature oocytes (blue circle). After MIH stimulation, the reporter mRNA is translated, which is detected by binding of ReAsH dye to the nascent polypeptide chains of TC-tag. The GFP protein is matured at the later stage. (B, C) Visualization of ReAsH signal in cleavage-stage embryos. Embryos derived from wild-type fish (B) and transgenic fish carrying the tgs gene (C) and treated with ReAsH dye showing the fluorescent ReAsH signal (ReAsH) in embryos expressing TC-tagged GFP (GFP) but not in wild-type embryos. GFP in yolk granule (asterisk) is unable to be detected by ReAsH dye for an unknown reason. (D, E) Real-time imaging of temporally controlled translation of the tgo3′ mRNA (D) and tg3′ mRNA (E). The times after MIH stimulation are shown as standardized time TGVBD (see text). Arrows indicate ReAsH signals detected at the first time after MIH treatment. Translation of tgo3′ mRNA was first detected at the time TGVBD = 59 at the animal pole of the oocyte. The translational site was retained at the animal pole during oocyte maturation (D). In contrast, translation of tg3′ mRNA was first detected at the time TGVBD = 24 at the animal pole of the oocyte. The translational site became widely distributed throughout the hemisphere of the oocyte during oocyte maturation (E). (F) Effects of puromycin treatment on the ReAsH signal. The oocyte expressing tgo3′ mRNA was injected with ReAsH dye and treated with MIH. The ReAsH signal detected after MIH treatment [Puro(-)] was dispersed by puromycin treatment [Puro(+)]. (G) The times that translation of the reporter mRNA occurs after MIH stimulation. Error bars indicate mean ± s.e.m., n = 7 for tgo3′ and n = 4 for tg3′, asterisk, P < 0.05 (Student′s t-test). GV, germinal vesicle. |
Reprinted from Developmental Biology, 348(1), Yasuda, K., Kotani, T., Ota, R., and Yamashita, M., Transgenic zebrafish reveals novel mechanisms of translational control of cyclin B1 mRNA in oocytes, 76-86, Copyright (2010) with permission from Elsevier. Full text @ Dev. Biol.