
Fig. 3
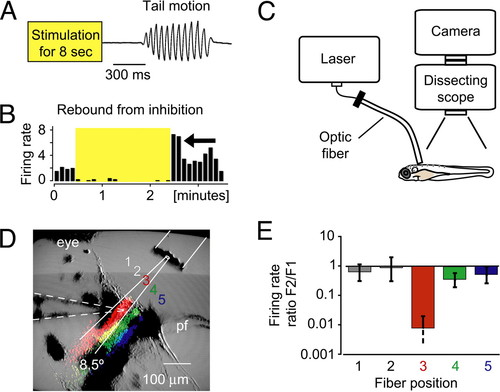
Use of fiber optics to control locomotion with NpHR. (A) Release from NpHR activation induced locomotion in head-restrained animals. The tail deflection is plotted over time. (B) The recorded cell showed an above-average firing rate directly after the stimulation (yellow shaded box) was stopped (arrow). (C) Fiber-optic setup for the mapping of the locomotion phenotype. An optic fiber was coupled to a laser and placed over the head-restrained larva with a micromanipulator. (D and E) Spatially defined light application was feasible with optic fibers. (D) The optic fiber (10-μm inner core diameter) was moved across the recorded cell in five steps. False-colored stripes in the image represent the scattered light that was detected by the camera when light was sent through the fiber at positions 3–5. The stripes of scattered light approximately match the theoretical divergence angle of the fiber (8.5°, white solid lines). Dashed lines outline the position of the electrode. pf, pectoral fin. (E) The firing rate ratio F2/F1 of a single cell is plotted for different fiber positions. The cell was only silenced when it was directly illuminated, which demonstrated the precise light application with optic fibers. |