
Fig. 1
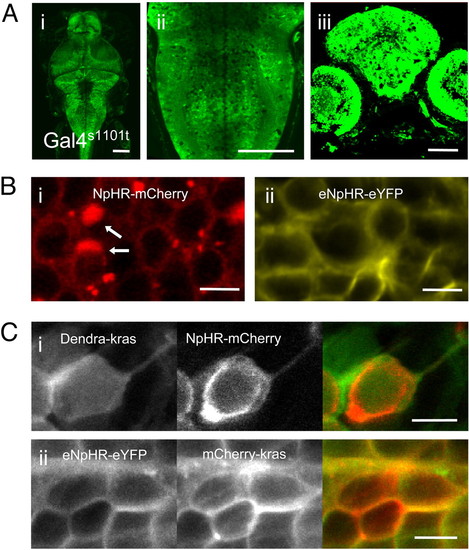
Expression of NpHR in zebrafish. (A) Expression pattern of Gal4s1101t; UAS:Kaede transgenic animals. Dorsal view (i), horizontal optical slice through the hindbrain (ii) and transverse section through the eyes and midbrain (iii) of 5 dpf animals. (B) Expression of NpHR in Gal4s1101t; UAS:(e)NpHR-XFP animals. (i and ii) NpHR-mCherry and eNpHR-eYFP, respectively. Intracellular blebs (arrows) are labeled in (i). (C) Surface targeting of NpHR. Co-expression of membrane-bound Dendra-kras and NpHR-mCherry in Gal4s1013t; UAS:Dendra-kras; UAS:NpHR-mCherry animals (i) reveals suboptimal surface targeting. Co-expression of eNpHR-eYFP and membrane-bound mCherry-kras in Gal4s1013t; UAS:eNpHR-eYFP; UAS:mCherry-kras animals, shows complete surface targeting of eNpHR-eYFP. [Scale bars, 100 μm in (A); 5 μm in (B and C).] |