
Fig. 2
- ID
- ZDB-FIG-101115-25
- Publication
- Qin et al., 2009 - Genetic evidence for shared mechanisms of epimorphic regeneration in zebrafish
- Other Figures
- All Figure Page
- Back to All Figure Page
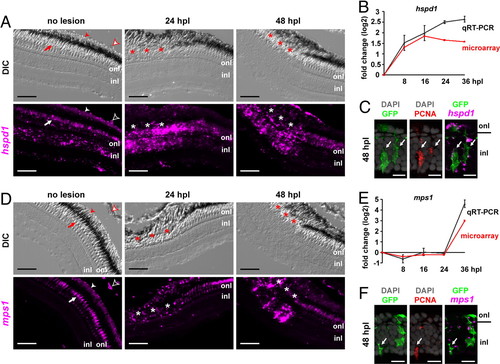
hspd1 and mps1 are up-regulated in injury-activated Müller glia during zebrafish photoreceptor regeneration. Expression patterns of hspd1 (A–C) and mps1 (D–F). (A and D) Fluorescent in situ hybridization of hspd1 and mps1 on retinal sections of Tg(gfap:GFP)mi2002 zebrafish. Autofluorescence in cones (arrow), rods (solid arrowhead), and red blood cells (empty arrowhead). Asterisks, lesioned area (note the disrupted retinal pigment epithelium). DIC, differential interference contrast. (B and E) Expression fold changes of hspd1 and mps1 in isolated GFP+ cells detected by qRT-PCR (gray) and microarray (red). Error bars represent SEM for 3 independent biological replicates. (C and F) Within the lesioned region at 48 hpl: in situ hybridization with hspd1 and mps1, respectively (magenta), produces discrete fluorescent dots associated with GFP+ neurogenic Müller glia (green) and anti-PCNA (red). Arrows indicate triple-labeled cells; onl, outer nuclear layer; inl, inner nuclear layer. These are not microglia, which are confined to the onl in the lesioned region (23). (Scale bars: 50 μm in A and D; 10 μm in C and F.) |